-
A
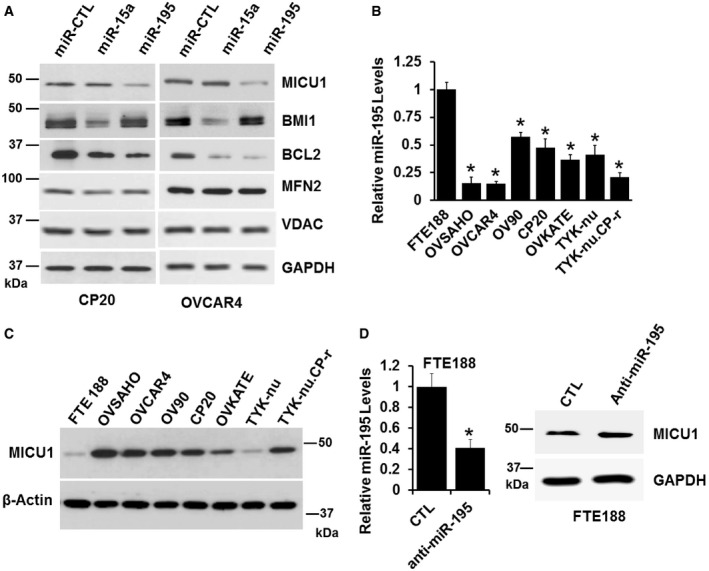
CP20 and OVCAR4 cells were transfected with either non‐target miRNA control (miR‐CTL), miR‐15a, or miR‐195. Seventy‐two hours following transfection, cells were lysed and immunoblotted for detection of MICU1, BMI1, BCL2, and MFN2. GAPDH and VDAC were used as loading control.
-
B
miR‐195 expression in FTE188 and ovarian cell lines as determined by RT–qPCR normalized with U6. Data are mean ± SD, n = 3 (biological repeats). *P < 0.05, Student's t‐test.
-
C
Expression of MICU1 in FTE188 and various ovarian cell lines as determined by immunoblotting. Actin is used as the loading control.
-
D
Anti‐miR-195 was transfected in the FTE188 cell line, level of miR‐195 was measured using RT–qPCR (left) and MICU1 levels were measured using immunoblotting (right). Data are mean ± SD, n = 3 (biological repeats). *P < 0.05, Student's t‐test.

