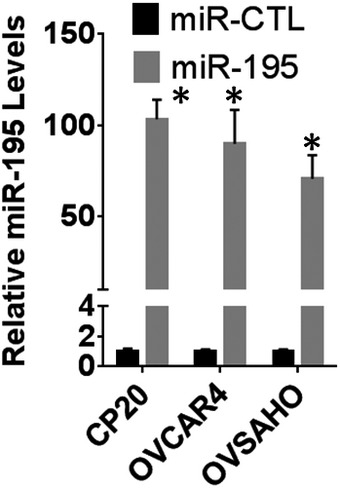
Figure EV2. Quantitation of microRNA expression.

Ovarian cancer cells were transfected with either non‐target microRNA (miR‐CTL) or miR‐195. Total RNA was isolated and miR‐195 levels normalized with U6 were plotted. Data are mean ± SD, n = 3 biological repeats, *P < 0.05, Student's t‐test.
