-
A
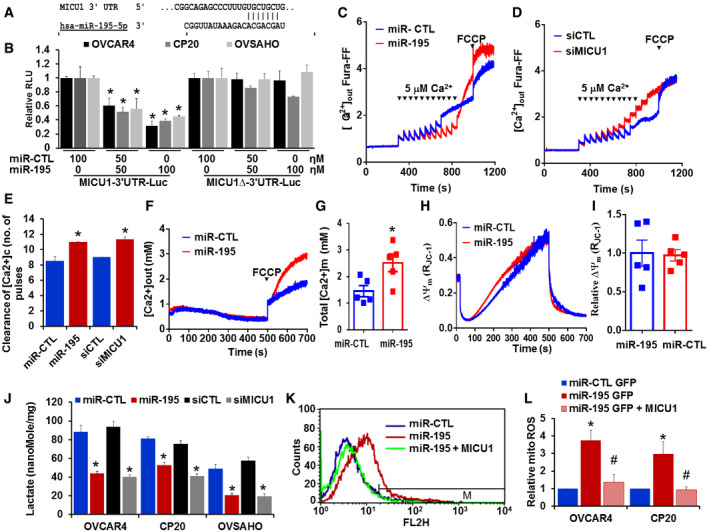
The miR‐195 binding site as predicted by TargetScan.
-
B
MICU1 3′ UTR in LightSwitch™ 3′ UTR Reporter Vector (wild type or miR‐195 binding site deleted) was co‐transfected with either non‐target miR‐control (miR‐CTL) or different concentrations of miR‐195. After 24‐h transfection, luciferase (Renilla) activity was measured. Relative light units (RLU) compared to miR‐CTL were plotted. Data are mean ± SD n = 3 (biological repeats). *P < 0.05, Student's t‐test.
-
C, D
CP20 cells were transfected as indicated, and 48 h post‐transfection, 4 × 10⁶ cells were permeabilized, and extra‐mitochondrial calcium ([Ca2+]out) clearance was measured, representative traces of [Ca2+]out‐ clearance in miR‐CTL and miR‐195 or control siRNA (siCTL) and siMICU1 transfected cells. [Ca2+]out pulses and FCCP were delivered as indicated.
-
E
Bar graph illustrating the number of Ca2+ pulses handled by control miR, miR‐195, siCTL, and siMICU1 transfected cells. Mean ± SEM; n = 3–4 (biological repeats). *P < 0.05, Student's t‐test.
-
F
Representative [Ca2+](m) traces after addition of FCCP (10 μM) in permeabilized CP20 cells transfected with non‐target miR‐CTL or miR‐195.
-
G
Quantification of resting matrix [Ca2+](m) after addition of FCCP. n = 5 (biological repeats) *P < 0.05, Student's t‐test.
-
H
Representative traces of mitochondrial membrane potential (∆Ψμ) in CP20 cells transfected with miR‐CTL or miR‐195.
-
I
Quantification of relative ∆Ψμ (n = 5, biological repeats).
-
J
Intracellular lactate was measured in miR‐CTL, miR‐195, siCTL, and siMICU1 expressing OVCAR4, CP20, and OVSAHO cells. n = 3, biological repeats *P < 0.05, Student's t‐test.
-
K, L
miR‐CTL, miR‐195, or miR‐195 + pLYS1‐MICU1‐Flag transfected cells were stained with MitoSOX Red, and mitochondrial ROS levels were determined by flow cytometry. The histogram shows representative staining and bar graph (right) shows results of three independent experiments. Mean ± SEM; n = 3, biological repeats. *P < 0.05 when comparing with miR‐CTL, #
P < 0.05 when comparing with miR‐195 by Student's t‐test.

