-
A
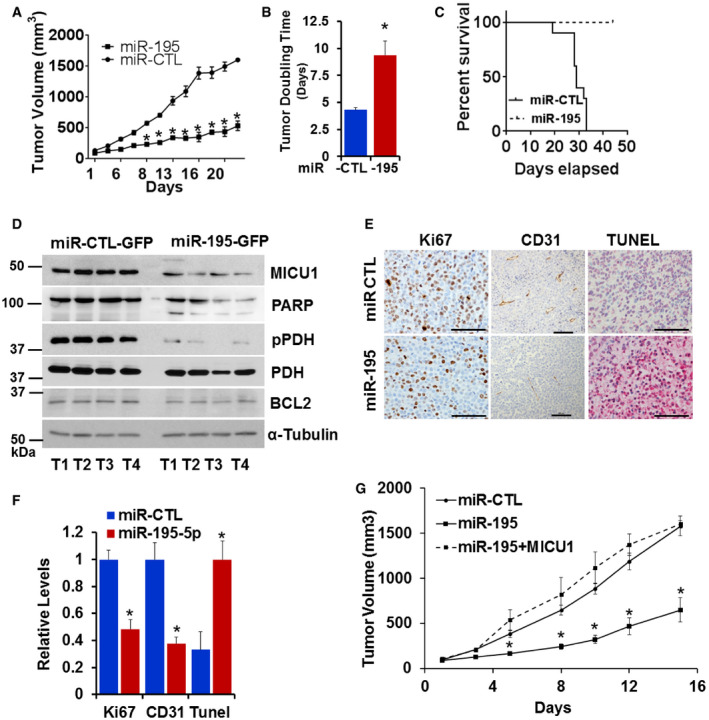
Female athymic mice were injected subcutaneously with either CP20 GFP‐miR-CTL or CP20‐ GFP-miR‐195 cells. Mice injected with the miR‐195 expressing cells (miR‐195) had significantly smaller tumor volumes than control mice (miR‐CTL). Data are mean ± SD, n = 10. *P < 0.05, Student's t‐test.
-
B
Tumor doubling time was significantly longer in the mice injected with miR‐195 expressing cells than in control mice. Data are mean ± SD, n = 10. *P < 0.05, Student's t‐test.
-
C
Percent survival based on humane endpoint criteria was calculated by the Kaplan–Meier method and P values determined by log rank test.
-
D
Four tumor samples from each group were analyzed for the expression of MICU1, pPDH, PDH, PARP, and BCL2 using immunoblotting. α tubulin was used as the loading control.
-
E, F
Representative histology images of tumors from mice xenografts of CP20‐GPF-miR‐CTL (miR‐CTL) or CP20‐GPF-miR‐195 (miR‐195) cells with Ki67 expression (Scale bar = 50 μm) (E), CD31 positive vessels (Scale bar = 100 μm) and TUNEL staining (Scale bar = 50 μm) and (F) graph showing quantification of each marker in tumors from the experimental mice; values are mean ± SD, n = 10, *P < 0.05, Student's t‐test.
-
G
Female athymic mice were injected subcutaneously with either CP20 GFP‐miR-CTL or CP20‐ GFP-miR‐195 or CP20‐ GFP-miR‐195 + MICU1 cells and tumor volume was measured, values are mean ± SE, n = 10. *P < 0.05, Student's t‐test.

