-
A
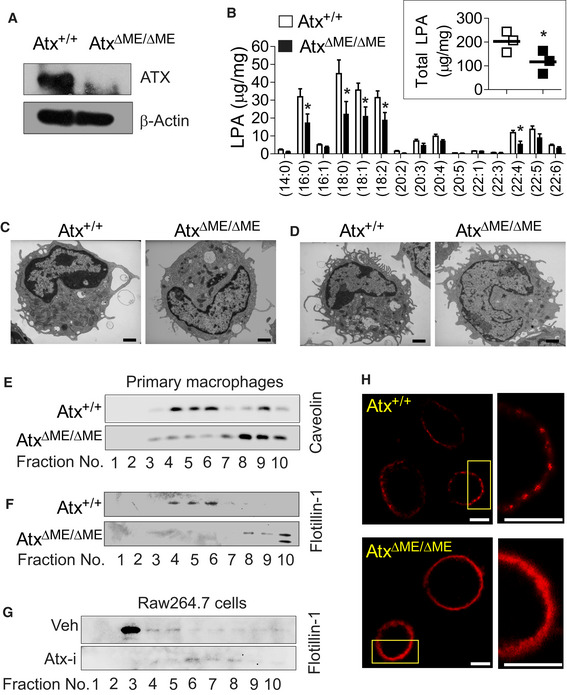
Total cell lysates of peritoneal macrophages from AtxΔΜΕ/ΔΜΕ mice and Atx+/+ littermates were subjected to immunoblotting analysis to confirm Atx deletion.
-
B
Peritoneal macrophages from the mice were subjected to the ESI‐MS/MS method to quantify endogenous LPA. Individual molecular species of LPA and total LPA (inset graph) were compared. The data are shown as mean ± SEM (n = 3/group) *P < 0.05 (one‐tailed unpaired t‐test).
-
C, D
Thioglycolate‐elicited peritoneal immune cells harvested from the mice were immediately fixed for transmission electron microscopy to visualize the appearance of macrophages (C) and DCs (D). Scale bar indicates 1 μm.
-
E–G
Lipid rafts from peritoneal macrophages (E, F) or from mouse macrophage Raw264.7 cells treated with Atx inhibitor (Atx‐i) PF8380 (50 μM, 30 min) or vehicle (Veh., DMSO 0.1%) (G) were fractionated into 10 fractions though sucrose density‐gradient ultracentrifugation at 100,000 g for 17 h. Protein was purified and concentrated with the 3K cutoff filter, followed by Western blot analysis with antibody recognizing the lipid raft marker proteins Caveolin or Flotillin‐1.
-
H
Peritoneal macrophages were stained with Alexa Fluor 594‐cholera toxin subunit B (Red). The plasma membrane was examined with FV10i confocal scanning microscopy. Inset areas were magnified at the right panel. Each scale bar indicates 10 μm.
Data information: Presented are the representative images of three independent experiments. In the confocal images, more than 95% of the cells exhibited similar results.

