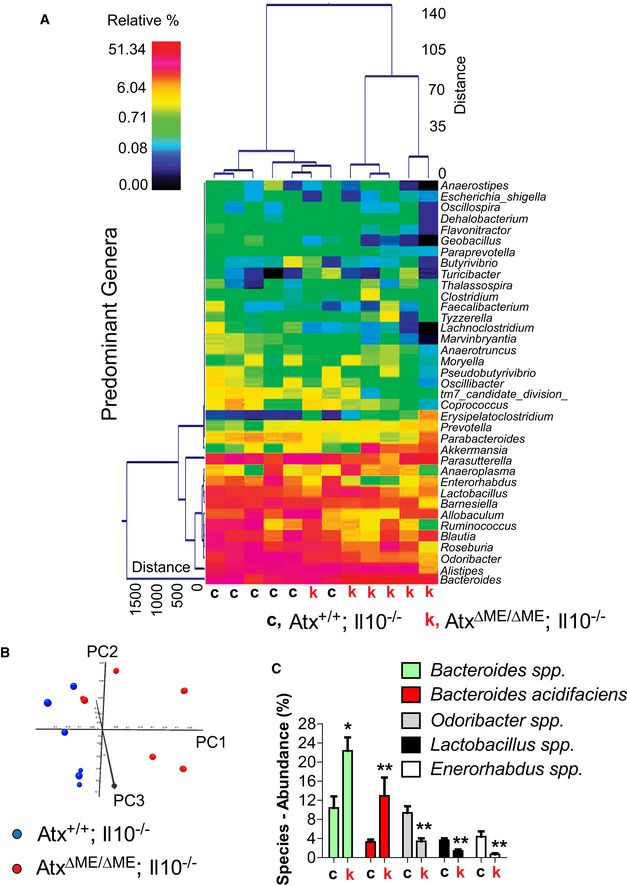
Fecal microbiome of age (8 weeks old)‐matched, co‐housed Atx
ΔΜΕ/ΔΜΕ;Il10
−/− mice and Atx
+/+;Il10
−/− littermates (
n = 6/group) was analyzed by 16S rRNA gene sequencing.
A dual hierarchal dendrogram was generated based on the predominant genera using Ward's minimum variance clustering and Manhattan distances. More similar microbial populations between AtxΔΜΕ/ΔΜΕ;Il10−/− and Atx+/+;Il10−/− mice were mathematically clustered closer together. The samples with a more similar consortium of genera cluster closer together with the length of connecting lines (top of heatmap) related to the similarity; shorter lines between two samples indicate closely matched microbial consortia. The heatmap represents the relative percentages of each genus. The legend for the heatmap is provided in the upper left corner. The predominant genera are represented along the right Y‐axis. AtxΔΜΕ/ΔΜΕ;Il10−/− mouse is indicated by “k”, while “c” stands for Atx+/+;Il10−/− mice.
Principal coordinates analysis (PCoA) plot of weighted UniFrac metrics was generated. PCoA plots represent the three (PC1, PC2, and PC3) highest discriminating axes, explaining 87.3 percent of the variation between the groups (P = 0.003).
The major species identified in the fecal samples of AtxΔΜΕ/ΔΜΕ;Il10−/− mice (k) and Atx+/+;Il10−/− littermates (c) were analyzed to compare the abundance at the species level. The abundance of Bacteroides was dramatically increased in the fecal samples of AtxΔΜΕ/ΔΜΕ;Il10−/− mice compared to Atx+/+;Il10−/− mice. Results are means ± SD, *P < 0.05, **P < 0.01 (Mann–Whitney U‐test).

