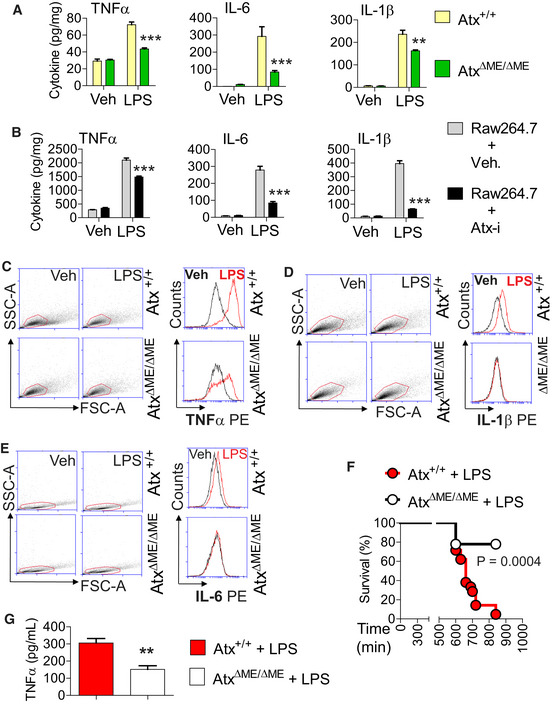
Figure 7. LPS‐induced cytokine production was reduced in Atx‐ko macrophages.

-
A, BPeritoneal macrophages from AtxΔΜΕ/ΔΜΕ mice and Atx+/+ littermates (A) or Raw264.7 cells (B) were stimulated with LPS (50 ng/ml, 8 h) in the presence/absence of the ATX inhibitor (50 μM, 30 min). The culture medium was collected for ELISA to measure the level of secreted cytokines. All assays were performed in triplicate, and data are shown as mean ± SEM.
-
C–EPeritoneal macrophages were stimulated with LPS or vehicle (endotoxin‐free water), after which intracellular cytokine production was measured through FACS analysis. With the scatter dot plot, the gate was set so that the viable cells were selected to analyze the intensity of the fluorescence signal by flow cytometry. The overlay plot represents the cytometry data.
-
FTo induce sepsis via LPS injection (Shirey et al, 2013; Voss et al, 2016), age (9–10 weeks)‐ and sex‐matched AtxΔΜΕ/ΔΜΕ mice (n = 9) and Atx+/+ littermates (n = 21) were injected with LPS (i.p. 25 mg/kg). Survival was monitored for up to 16 h, and analyzed by the Kaplan‐Meier method (Log‐rank P = 0.0004).
-
GBlood samples were collected from AtxΔΜΕ/ΔΜΕ (n = 7) and Atx+/+ (n = 6) mice 10 h after LPS injection, after which the serum TNFα protein level was measured. The data are shown as mean ± SEM.
