
Figure 8. Innate immune effector function was suppressed in Atx‐ko macrophages compare to controls.
-
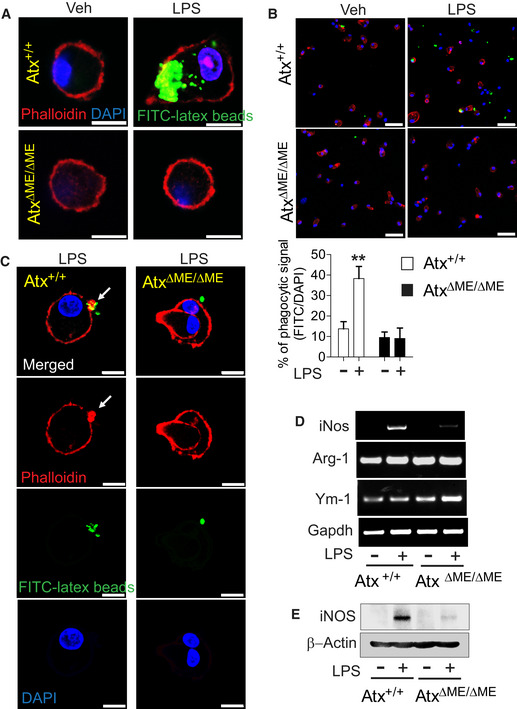
A, BConfocal laser scanning micrographs of the macrophages from AtxΔΜΕ/ΔΜΕ mice and Atx+/+ littermates. Cells were incubated with IgG‐opsonized latex beads in the absence/presence of LPS (20 ng/ml, 2 h) and stained with Phalloidin (F‐actin) and DAPI. Internalized beads were examined under a higher(A) and a lower magnification (B) to quantify % phagocytosis by dividing latex bead‐positive cell numbers by the total number of DAPI‐positive cells (n = 11–16 per group). The data are analyzed with results accumulated from three independent experiments and shown as mean ± SEM (B). **P < 0.01 (Mann–Whitney U‐test). Scale bars are 5 μm (A) and 50 μm (B), respectively.
-
CLPS‐stimulated macrophages were co‐incubated with IgG‐opsonized latex beads for 40 min. Phagocytic cups were visualized by F‐actin staining with Phalloidin‐iFluor 647. The arrow indicates the phagocytic cup formed in the plasma membrane. Scale bar is 10 μm.
-
D, EAfter LPS (20 ng/ml, 4 h) treatment, LPS‐induced iNos, Arginase‐1 (Arg‐1), and Ym‐1 mRNA expression were evaluated by semi‐quantitative PCR (D). With LPS stimulation (20 ng/ml, 8 h), iNOS protein production was examined by immunoblotting analysis (E).