-
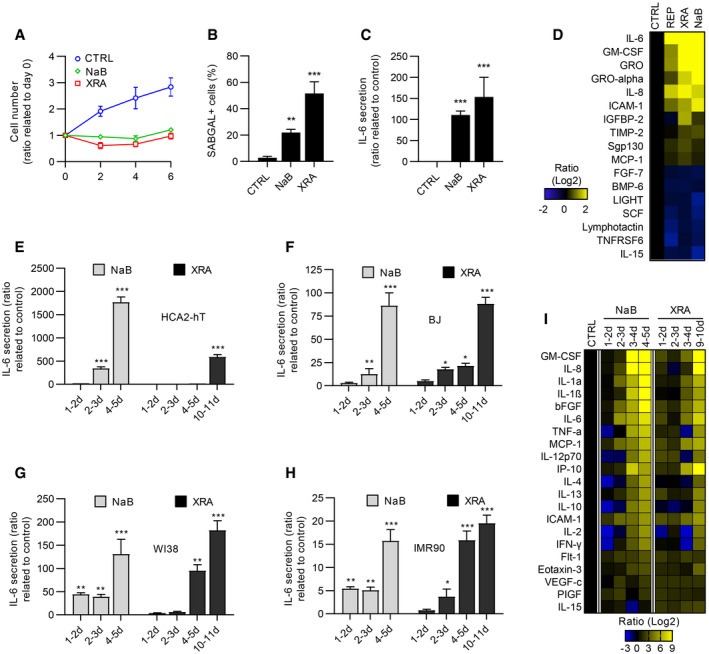
A
HCA2‐hT cells that were untreated, irradiated (10 Gy of XRA), or treated with 5 mM of sodium butyrate (NaB) were fixed at 2, 4, and 6 days following treatment. Cell proliferation was evaluated using DRAQ5 staining. Fluorescence intensity was reported on day 0. Data are means ± SD of triplicates and are representative of two independent experiments.
-
B
SA‐ß‐galactosidase assays of HCA2‐hT cells fixed 9 days post‐XRA (10 Gy) or NaB treatment (2 mM). Data are means ± SD of triplicates and are representative of two independent experiments.
-
C
IL‐6 secretion was analyzed by ELISA in conditioned media (CM) of HCA2‐hT cells that were collected 9 days after XRA (10 Gy) or NaB (2 mM). Data are the means ± SD of triplicates and are representative of three independent experiments.
-
D
Soluble factors secreted by untreated or senescence‐induced HCA2 cells: replicative senescence (REP), 10 days post‐XRA(10 Gy) or treated 10 days with 2 mM of NaB were analyzed by antibody arrays.
-
E–H
(E) HCA2‐hT, (F) BJ, (G) WI‐38, or (H) IMR‐90 cells were treated with NaB (5 mM) or XRA (10 Gy). CM were collected for the indicated period and IL‐6 secretion was assessed by ELISA. Data are means ± SD of triplicates and are representative of three independent experiments.
-
I
HCA2‐h cells were treated with NaB (5 mM) or XRA (10 Gy) and CM were collected for the indicated period. Secretion of 40 soluble factors was measured by a multiplex immunoassay (40‐Plex MSD®). Data represent the means of two independent experiments.
Data information: For (D) and (I), average secretion of control cells was a reference for baseline. Heat map key indicates log
2‐fold changes from the control. Only factors that were significantly modulated between control and senescent cells at
P = 0.05 are displayed. Unpaired
t‐test: *
P < 0.05, **
P < 0.01, ***
P < 0.001.

