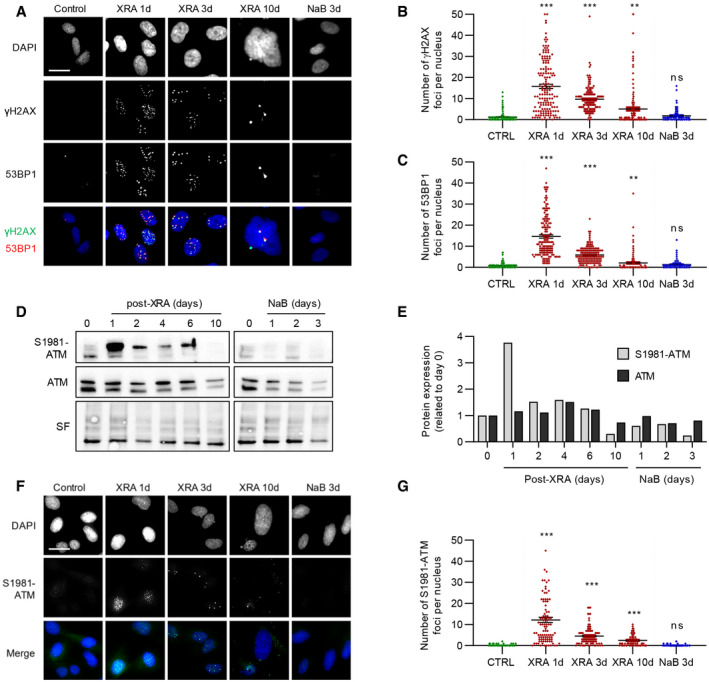
BJ cells were untreated, irradiated with 10 Gy of XRA, or treated with 5 mM of NaB.
-
A
Fluorescence images of 53BP1 and γH2AX stained by immunofluorescence in cells fixed at the indicated times. DAPI was used for nuclear counterstain. Bar scale = 25 μM.
-
B, C
Quantification of the number of (B) γH2AX or (C) 53BP1 foci per nucleus (n = 150) using ImageJ. Means ± SEM of foci per nucleus were represented.
-
D
Western blot analysis of phosphorylated ATM (S1981‐ATM) or total ATM expression in BJ cells untreated (time 0), treated with NaB or XRA. Stain‐free (SF) imaging of the membrane was used as loading control.
-
E
Quantification of S1981‐ATM and ATM expression detected in D using Image Lab (Bio‐Rad). Bars represent the ratio of expression related to the control.
-
F
Images of S1981‐ATM immunofluorescence (green) and DAPI staining in control, irradiated or NaB‐treated BJ cells. Bar scale = 25μM
-
G
Quantification of S1981‐ATM foci per nucleus (n = 150) using ImageJ. Means ± SEM of foci per nucleus were represented.
Data information: Unpaired
t‐test:
P < 0.05, **
P < 0.01, ***
P < 0.001, ns: non‐significant. Data are representative of three or more independent experiments.

