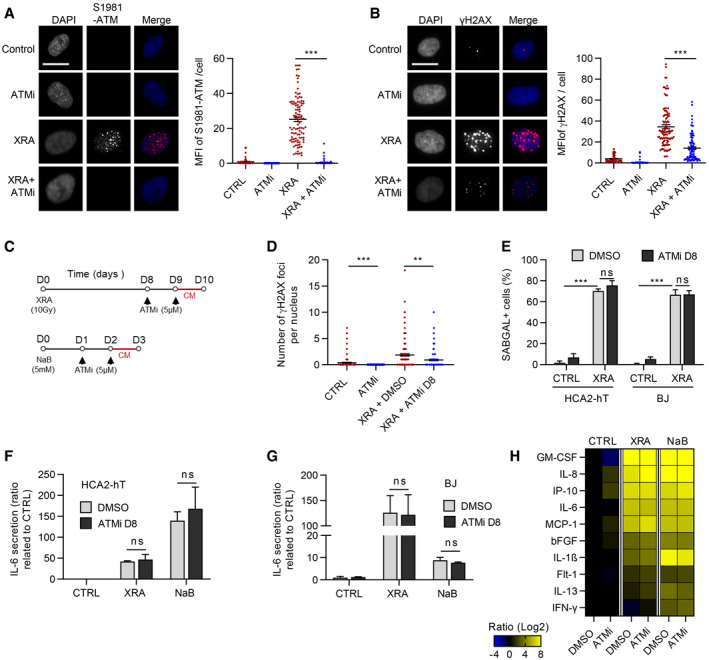
Figure 4. ATM kinase activity is not involved in NaB‐ and XRA‐SASPs.

-
A, BHCA2‐hT cells were treated with 5 μM of Ku‐55933, an ATM inhibitor (ATMi), for 2 days and irradiated with 1 Gy of XRA. Two hours post‐XRA, cells were fixed and analyzed for S1981‐ATM or γH2AX immunofluorescence. (A) Fluorescence images of S1981‐ATM (red) and DAPI staining (left panel), and quantification of the S1981‐ATM mean fluorescence intensity (MFI) per nucleus (n = 150; right panel). (B) Fluorescence images of γH2AX (red) and DAPI staining (left panel), and quantification of the γH2AX foci number per nucleus (n = 150; right panel). Means of foci or MFI per nucleus ± SEM are shown, representative of two independent experiments. Bar scale = 10μM
-
CTimeline summarizing the sequence of XRA (10 Gy), NaB (5 mM), and Ku‐55933 (ATMi, 5 μM) treatments and the collection of the conditioned media (CM) used for figures D–H.
-
DQuantification of the γH2AX foci per nucleus (n = 150) of HCA2‐hT cells untreated (Control), treated with ATMi for 2 days (ATMi), 10 days post‐XRA with DMSO (XRA) or ATMi (XRA + ATMi D8) added for the last 2 days. Representative images of the immunofluorescence are given in Fig EV3A. Means of foci or MFI per nucleus ± SEM are representative of two independent experiments.
-
EBJ and HCA2‐hT cells were treated with the same conditions as in (D) and assessed for SA‐ß‐galactosidase assay. Data are mean ± SD of triplicates and are representative of two independent experiments.
-
F, GIL‐6 secretion assessed by ELISA in CM of (F) HCA2‐hT or (G) BJ cells untreated, irradiated or treated with NaB +/− ATMi. Data are the means ± SD of triplicates and are representative of three independent experiments.
-
HSecreted soluble factors by HCA2‐hT cells untreated (Control), irradiated, or treated with NaB +/− ATMi were quantified using multiplex immunoassay (40‐Plex MSD®). Average secretion of control cells was used as baseline. Heat map key indicates log2‐fold changes from control. Data represent two independent experiments.
