-
A–H
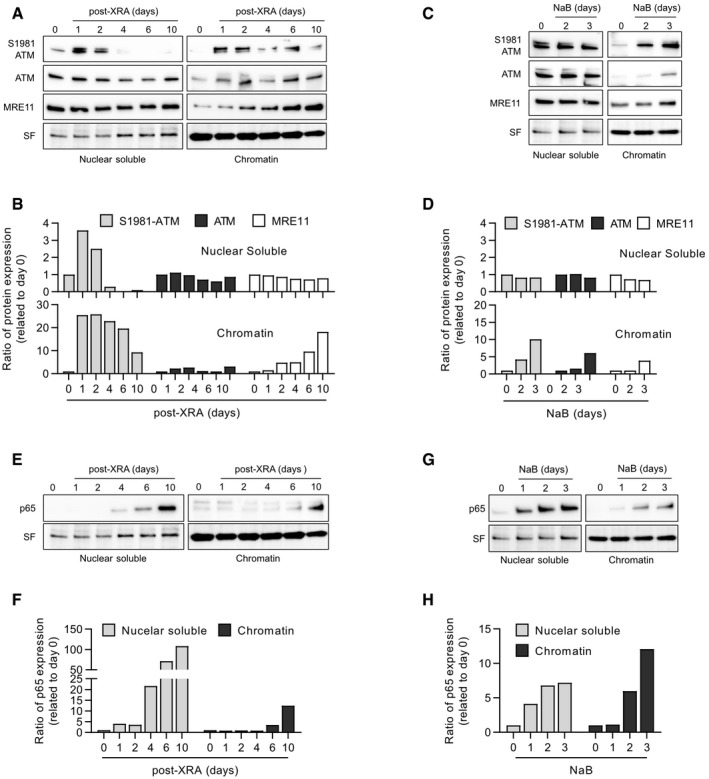
HCA2‐hT cells were untreated (time 0), irradiated with 10 Gy of XRA or treated with 5 mM of NaB. At the indicated times, cells were collected and protein from the nuclear soluble and chromatin fractions were isolated by subcellular fractionation. Expression of S1981‐ATM, ATM, MRE11, or p65 was assessed by Western blot. (A) Western blot images and (B) quantification of S1981‐ATM, ATM, and MRE11 protein expression from irradiated HCA2‐hT cells. (C) Western blot images and (D) quantification of S1981‐ATM, ATM, and MRE11 protein expression from HCA2‐hT cells treated with NaB. (E) Western blot images and (F) quantification of p65 protein expression from irradiated HCA2‐hT cells. (G) Western blot images and (H) quantification of p65 protein expression from HCA2‐hT cells treated with NaB.
Data information: Stain‐free (SF) imaging of the membrane was used as loading control. For quantification (Image Lab™, Bio‐Rad), data were normalized using the total protein quantification from the SF imaging. Protein expression at time 0 was used as baseline. These data are representative of three independent experiments.
Source data are available online for this figure.

