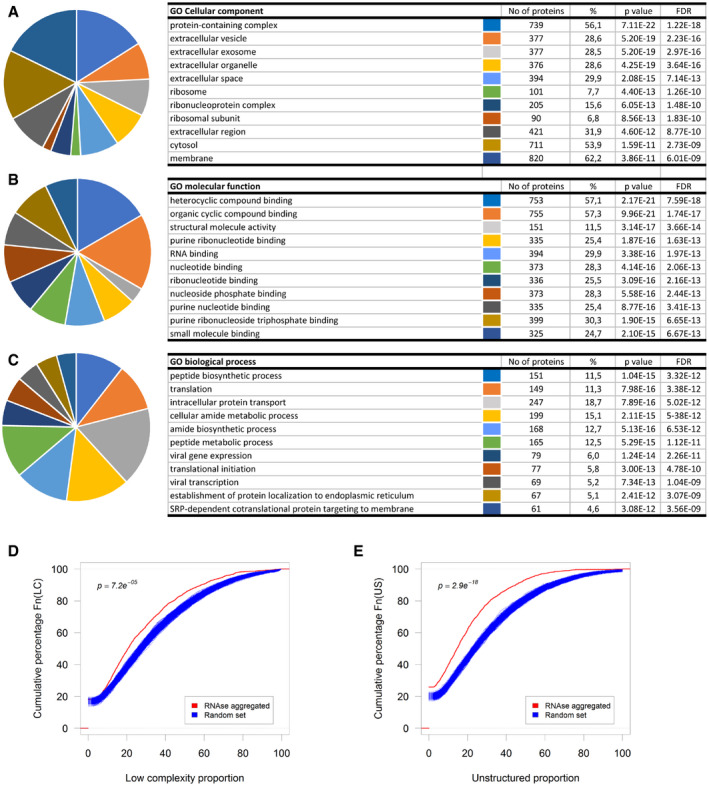
Figure EV2. Computational analysis of proteins aggregated by enzymatic degradation of RNA .

-
A–CTop ten gene ontology classes by Cellular component (A), Molecular function (B), or Biological process (C).
-
D, ECumulative distribution of the proportion of predicted low‐complexity regions (D) or unstructured regions (E) in the RNase‐aggregated proteins (Red) or random sets of proteins (Blue).
