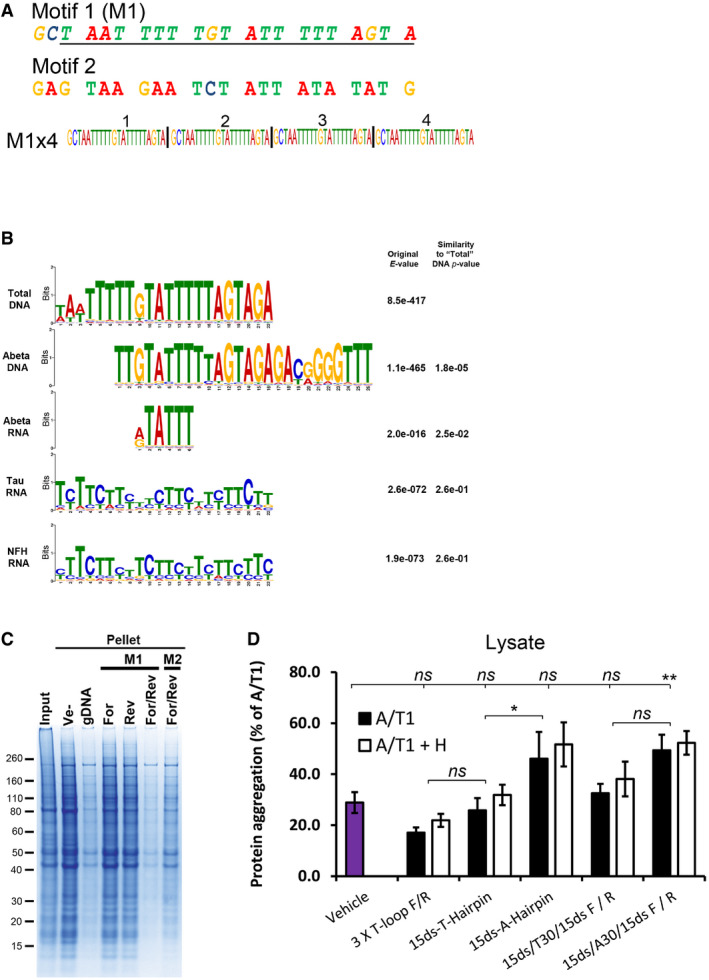
Figure EV5. Computational and experimental comparison of selected motifs and structural oligonucleotides.

-
ASequence of the selected M1 motif and a random control oligo (Motif 2, M2) investigated for their renaturing capacity. Both motifs were assembled into four consecutive repeats of the same motif (e.g. M1x4). The underlined region of M1 represents the computationally identified motif while the two extra 5′ nucleotides (GC) were added for cloning purposes.
-
BAlignment of motifs identified in the nucleic acids associated with soluble proteins after renaturation. All motifs are compared with the M1 motif identified in the Total DNA samples. The quoted original E‐value represents the value obtained in the MEME‐Chip analysis and the Similarity P‐value is the P‐value given by the TomTom motif comparison software package, compared with the Total DNA motif.
-
CCoomassie‐stained SDS‐PAGE gel of aggregated proteins (Pellet) following renaturation with either single‐stranded (For or Rev) or complementary (For/Rev) M1x4 or M2x4 DNA oligonucleotides. gDNA represents genomic DNA, and Ve‐ represents vehicle.
-
DAmount of protein aggregation observed after treating cell lysate from Jurkat T cells with various oligonucleotides and RNase A/T1 (A/T1) and, if indicated, together with RNase H (A/T1 + H).
