-
A
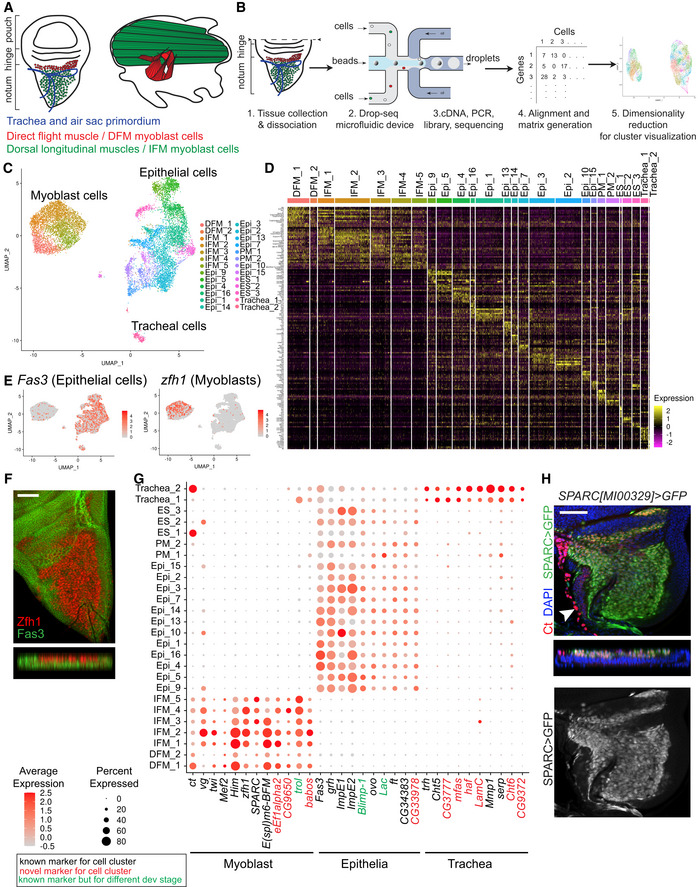
Origin of the flight muscles. Left panel: Trachea, air sac primordium, IFM myoblasts and DFM myoblasts in the adepithelial layer overlaying the wing disc epithelium. Right panel: Lateral view of the adult flight muscles in the thorax.
-
B
Workflow for droplet‐based scRNA‐seq. Wandering third instar larval wing discs were dissected, and pouch was removed and dissociate into single‐cell suspension. Droplets containing unique barcoded beads and single cells were collected. Following library preparation, sequencing data were aligned, and a gene‐cell expression matrix was generated and analysed using Seurat for identification of variable genes and unsupervised cell clustering based on gene expression similarity.
-
C
Annotated cell type, including 6,711 epithelial, 272 tracheal and 4,544 myoblast cells, in UMAP plot of the reference single‐cell atlas.
-
D
RNA expression heatmap showing the top differentially expressed gene markers for each cluster of the reference single‐cell atlas dataset. Cells (column) are clustered by the expression of the main marker genes (row).
-
E
Average expression level of the genes Fas3 (left panel) and zfh1 (right panel) used as markers to assign epithelial and myoblast cells, respectively, in the reference dataset.
-
F
Confocal single plane image of third instar larval wing disc and orthogonal views of the disc stained with anti‐Zfh1 (red) and anti‐Fas3 (green).
-
G
Dot plot showing the expression levels of the marker genes identified for the myoblast, epithelial and tracheal cells across the 26 clusters of the reference cell atlas. Colour intensity represents the average normalized expression level. Dot diameter represents the fraction of cells expressing each gene in each cluster. Gene expression for each cell was normalized by the total expression, and then, the expression of each gene was scaled.
-
H
Confocal single plane image of third instar larval wing disc and orthogonal view of SPARC>GFP (green) stained with anti‐Ct (red) and 4′,6‐diamidino‐2-phenylindole (DAPI, blue). Full genotype y‐, w-/w‐; UAS‐GFP/+; SPARC‐GAL4/+.
Data information: Scale bars: 50 μm. White arrowhead: Ct expression in tracheoblasts.

