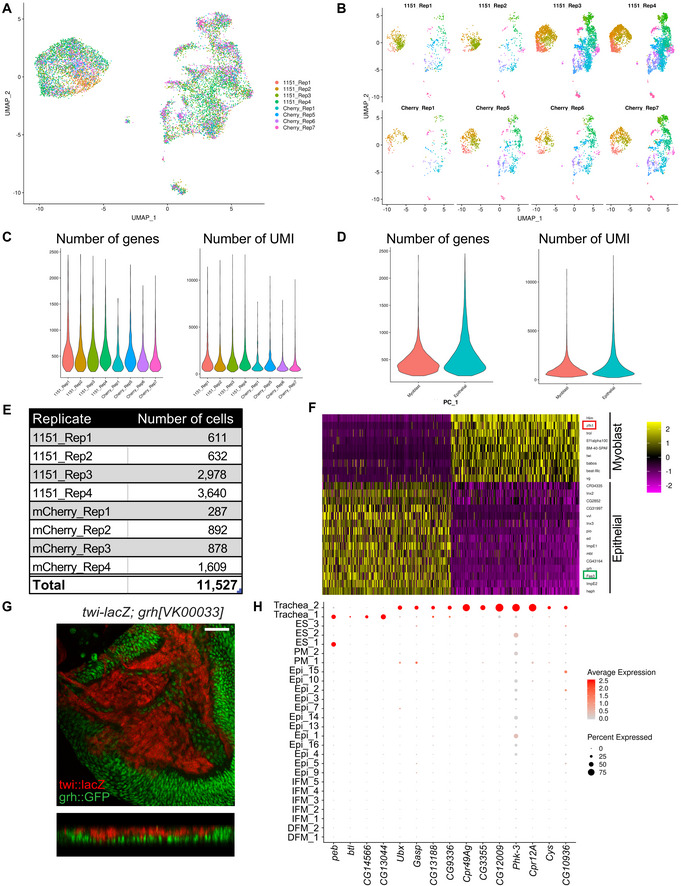
Figure EV1. Single‐cell atlas of the proximal wing imaginal disc. Related to Fig 1 .

-
A, BUMAP plot of the wild‐type reference single‐cell atlas generated from wandering third instar larval wing discs coloured by replicates (A) and split by replicates (B). Four replicates 1151‐GAL4 are indicated as 1151 and 4 replicates 1151>mCherry‐RNAi as Cherry.
-
C, DNumber of genes with at least 1 UMI count and number of UMI across all cells (left and right panel, respectively) grouped by replicates (C) and cell type (D).
-
ETotal number of cells per sample in the reference atlas after applying filters and removing clusters that were unevenly represented across replicates.
-
FDimensions of the data were reduced by PCA. Genes (rows) and cells (columns) were ordered by their PCA scores. Heatmap showing distribution of the 500 most extreme cells and 30 most extreme genes. PC1 separates epithelial cells from myoblast cells as indicated by the muscle‐specific genes Him and zfh1, and the epithelial genes Fas3 and grh.
-
GConfocal single plane images of wandering third instar larval wing discs and orthogonal view of twi‐lacZ (β‐gal, in red) and grh::GFP (green). Scale bars: 50 μm. Full genotype: w‐; twi‐lacZ; grh[VK00033]::GFP.
-
HDot plot showing the expression of the main markers distinguishing Trachea_1 from Trachea_2 across all clusters of the reference atlas.
