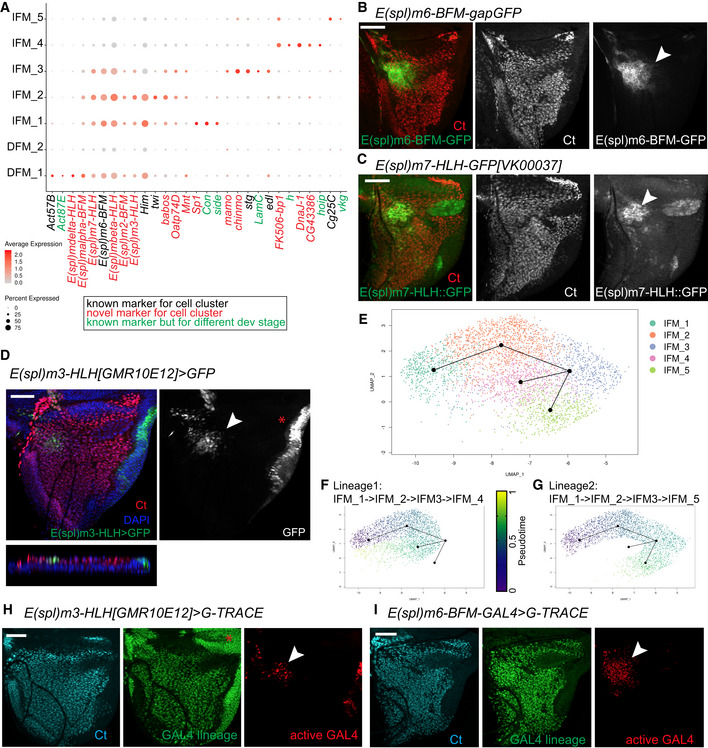
Figure 4. IFM and DFM myoblast clusters uncover different state of differentiation.

-
ADot plot showing the expression levels of the top variable genes between myoblasts across 7 clusters of the reference cell atlas dataset.
-
B–DConfocal single plane images of third instar larval wing discs stained with anti‐Ct (red) and (B) E(spl)m6‐BFM-gapGFP (green), (C) E(spl)m7‐HLH[VK00037]‐GFP (green), or (D) E(spl)m3‐HLH[GMR10E12]>GFP (green).
-
E–GSlingshot used for inferring cell lineages and pseudotime among the IFM myoblasts. (E) Two lineages for IFM myoblast clusters visualized in subset of 3,492 cells in UMAP plot of the reference single‐cell atlas dataset. (F) Pseudotime inference in Lineage 1 is from IFM_1 → IFM_2 → IFM_3 → IFM_4. (G) Pseudotime inference in Lineage 2 is from IFM_1 → IFM_2 → IFM_3 → IFM_5.
-
H, IConfocal single plane images of third instar larval wing discs stained with anti‐Ct (cyan) showing the lineage of GAL4 (green) and the active GAL4 (red) in (H) E(spl)m3‐HLH[GMR10E12]>gTRACE and (I) E(spl)m6‐BFM-GAL4>gTRACE.
