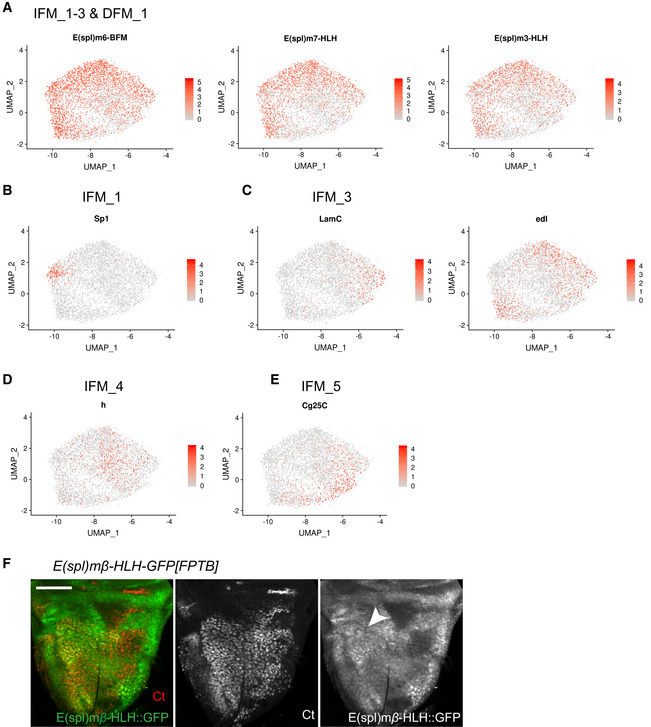
Figure EV4. Markers for different state of differentiation. Related to Fig 4 .

-
A–EAverage expression level of the genes identified as markers for the myoblast clusters assigned as in the reference atlas dataset. Marker gene for (A) IFM_1‐3 and DFM_1 are E(spl)‐m6-BFM, E(spl)‐m7-HLH, E(spl)‐m3-HLH, (B) IFM_1 is Sp1, (C) IFM_3 are LamC and edl., (D) IFM_4 is h and (E) IFM_5 is Cg25C.
-
FConfocal single plane image of third instar larval wing discs E(spl)‐mbeta‐HLH-GFP[FPTB] stained with anti‐Ct (red). Scale bar: 50 μm. Full genotype: y‐ w-; P{E(spl)mbeta‐HLH-GFP.FPTB}attP40.
