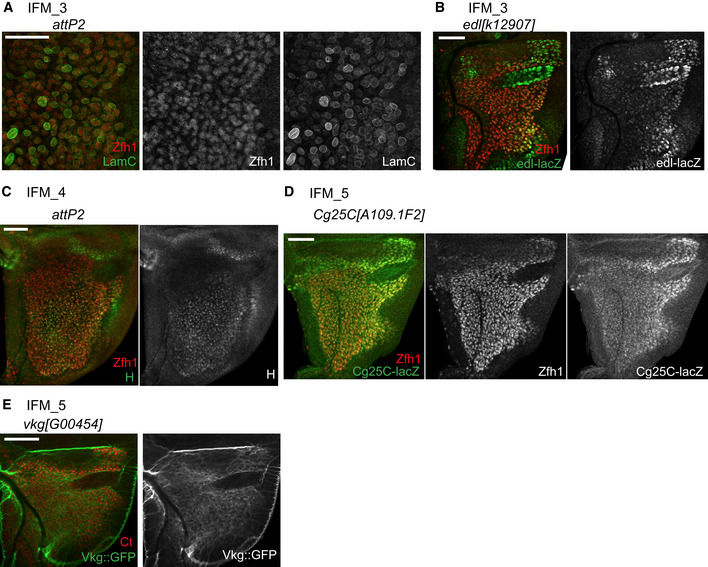
Figure 5. Exploring clusters of IFM myoblasts reveals their heterogeneity.

-
A–EConfocal single plane images of third instar larval wing discs stained with (A) anti‐LamC (green) and anti‐Zfh1 (red), (B) edl[k12907]‐lacZ (green) and anti‐Zfh1 (red), (C) anti‐H (green) and anti‐Zfh1 (red), (D) Cg25C[k00405]‐lacZ (green) and anti‐Zfh1 (red), or (E) vgk[G00454]‐GFP (green) and anti‐Ct (red).
