-
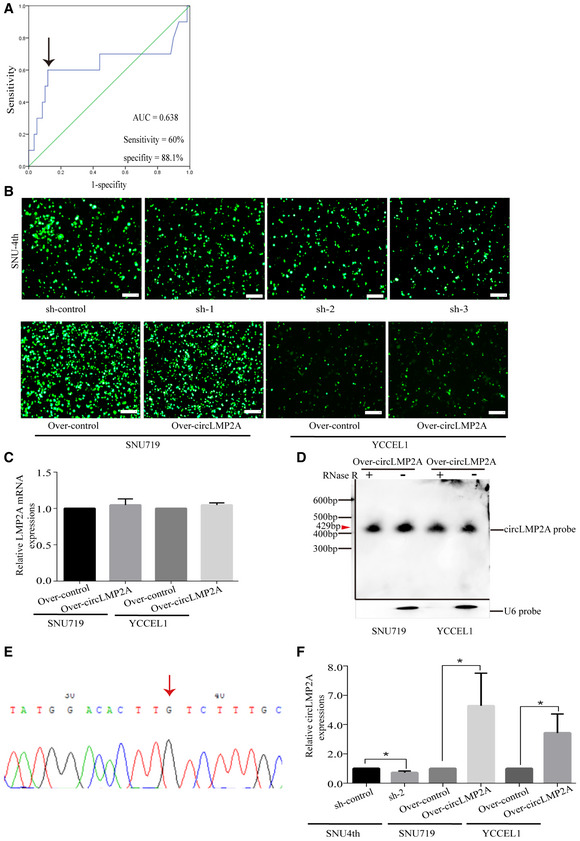
A
ROC curves for the discrimination of patients with high or low expression of circLMP2A. The black arrow indicates the cut‐off value (left).
-
B
Fluorescence microscopy showing the expression of GFP‐labelled plasmids in SNU‐4th, SNU719 and YCCEL1 cells.
-
C
The linear LMP2A mRNA levels were detected by real‐time PCR.
-
D
Northern blots for the detection of circLMP2A in SNU719 and YCCEL1 cells (circLMP2A over‐expressing stable transfectants) treated with or without RNase R digestion. Please note that the image was assembled from different blots (indicated by the black lines). The red arrow indicates the size of circLMP2A (429 bp).
-
E
The back‐spliced sequence of circLMP2A from the over‐expression system was validated by Sanger sequencing. The red arrow indicates the “head‐to-tail” splicing sites of circLMP2A.
-
F
The expression of circLMP2A was detected in xenograft tissues from in vivo tumorigenicity experiments using RT–qPCR.
Data information: Results are presented as the mean ± SD,
n = 3 biological replicates, scale bar = 100 μm, *
P <
0.05, Student's
t‐test.