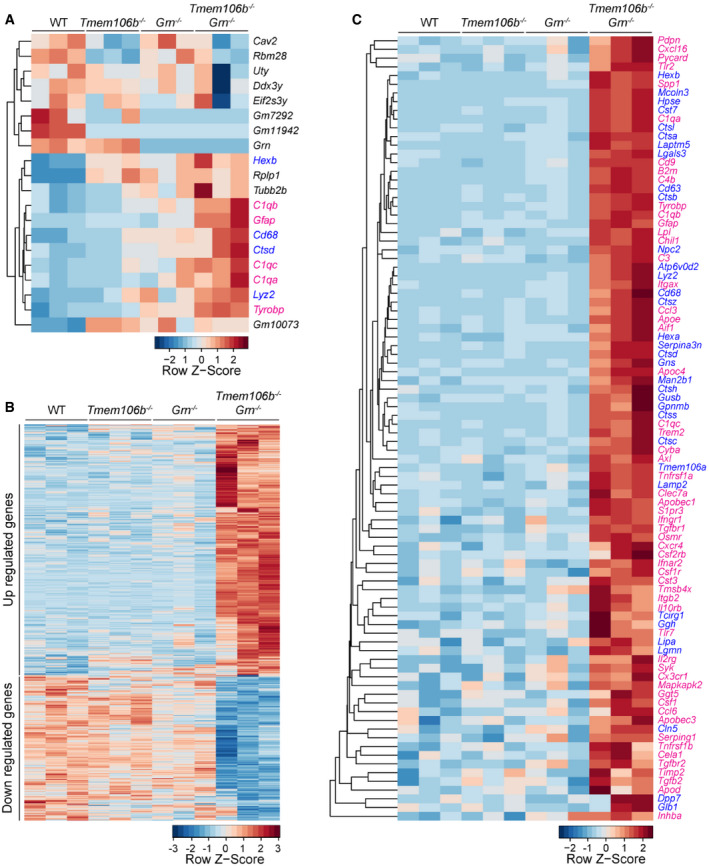
Figure 6. Transcriptome analysis reveals increased expression of inflammation and lysosome genes in Tmem106b −/− Grn −/− mice.

-
A, BHeatmap illustrating gene expression changes in WT, Tmem106b −/− , Grn −/− , and Tmem106b −/− Grn −/− cortex (A) and spinal cord (B) samples isolated from 2.7‐month‐old mice. n = 3. Genes with FDR P ≤ 0.05, LogFC ≥ 0.5 or ≤ 0.5 between WT and Tmem106b −/− Grn −/− groups are plotted based on hierarchical clustering analysis.
-
CHeatmap illustrating gene expression changes in the inflammation and lysosome pathways in WT, Tmem106b −/−, Grn −/−, and Tmem106b −/− Grn −/− spinal cord samples.
