
Figure 2. FAM111A proteolytic activity displaces RFC from chromatin and inhibits DNA replication.
-
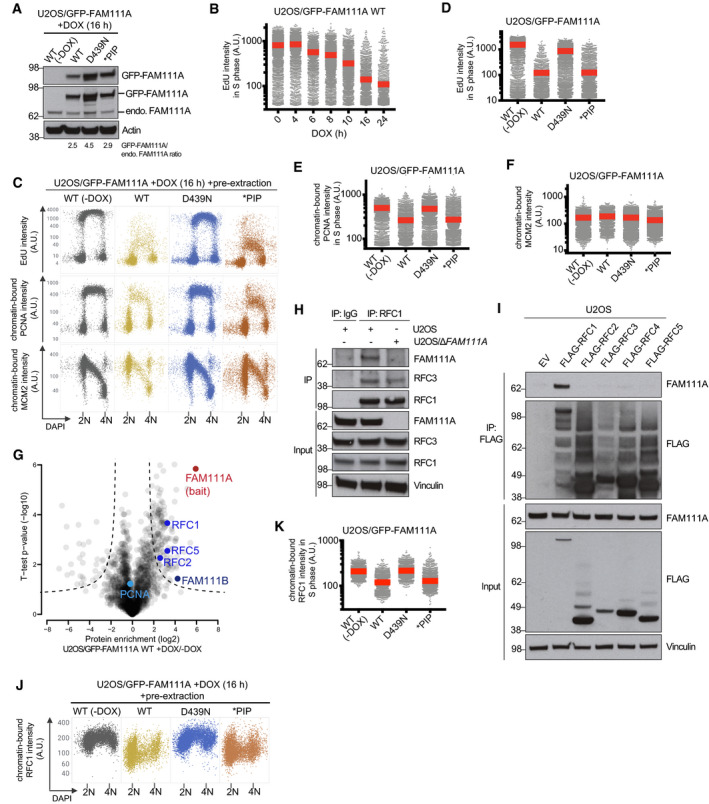
AImmunoblot analysis of stable U2OS cell lines left untreated or incubated with DOX to induce expression of WT or mutant forms of GFP‐FAM111A.
-
BDNA replication rates in U2OS/GFP-FAM111A cells treated with DOX for the indicated times, pulse‐labeled with EdU, and stained with DAPI were analyzed by quantifying EdU signal intensity in S phase cells using quantitative image‐based cytometry (QIBC) (red bars, mean (A.U., arbitrary units); n > 2,000 cells per condition). See also Appendix Fig S6A.
-
CCells treated as in (B) were pre‐extracted, fixed, and stained with PCNA or MCM2 antibody, and subsequently analyzed by QIBC (n > 2,000 cells per condition).
-
D–FQuantification of data in (C) (red bars, mean). Cells in S phase were identified based on EdU positivity. See also Appendix Fig S6B–D.
-
GAnalysis of FAM111A interactors. U2OS/GFP‐FAM111A WT cells were treated or not with DOX for 4 h, subjected to GFP immunoprecipitation (IP), and analyzed by mass spectrometry. Volcano plot shows enrichment of individual proteins (+DOX/−DOX ratio) plotted against the P value. Dashed lines indicate the significance thresholds (FDR < 0.05; s 0 = 1).
-
HU2OS or U2OS/ΔFAM111A cells were subjected to IP with IgG (control) or RFC1 antibody followed by immunoblotting with indicated antibodies.
-
IU2OS cells transfected with empty vector (EV) or indicated RFC subunit expression plasmids were subjected to FLAG IP and immunoblotted with indicated antibodies.
-
JAs in (C), except that cells were stained with RFC1 antibody (n > 2,000 cells per condition).
-
KQuantification of data in (J) for S phase (EdU‐positive) cells (red bars, mean).