-
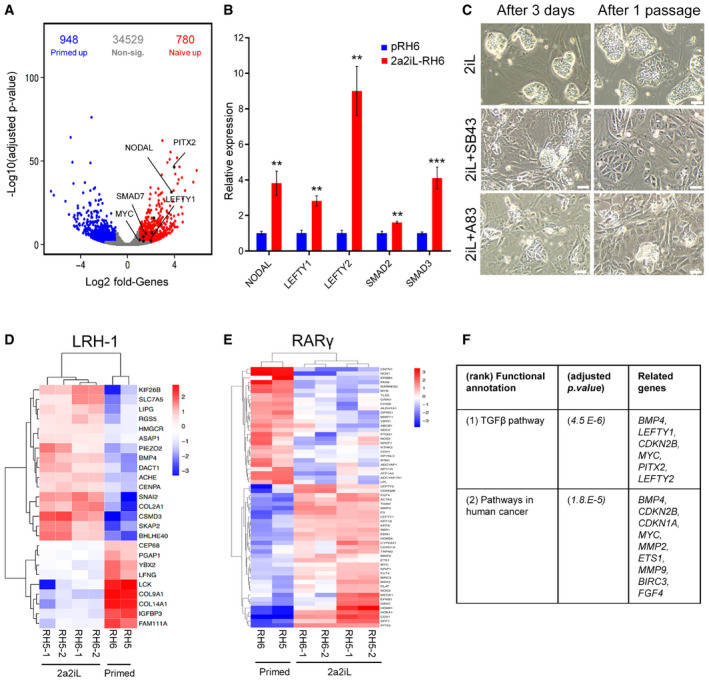
A
Position of TGF‐β family members in the volcano plot of differentially expressed genes in 2a2iL‐ and primed hPSCs. X‐axis shows log2 fold change, and y‐axis shows negative log10 adjusted P‐value < 0.05 (adjusted P‐value was obtained using the Benjamini and Hochberg correction to determine the false discovery rate). Red and blue points represent upregulated genes in 2a2iL‐ and primed hPSCs, respectively. Genes with no significant expression change are shown in gray.
-
B
qRT–PCR analysis of several TGF‐β‐related genes in pRH6 and 2a2iL‐RH6. **P < 0.01, ***P < 0.001 (t‐test). Data presented as mean ± SD (n = 3).
-
C
Inhibition of the TGF‐β pathway by two small molecules, SB43 and A83. Left panel: morphology of naïve‐like cells 3 days after treatment. Right panel: morphology of treated cells after passaging. Scale bar: 100 μm.
-
D
Heatmap shows expression of putative LRH‐1 target genes in this study's transcriptome profiles. Colors indicate log2 fold change of marker genes in the naïve versus primed hPSCs, with a range from dark blue for lower expression to dark red for higher expression.
-
E
Heatmap shows expression of putative RARγ target genes in this study's transcriptome profiles. Colors indicate log2 fold change of marker genes in the naïve versus primed hPSCs, with a range from dark blue for lower expression to dark red for higher expression.
-
F
KEGG analysis of putative LRH‐1 and RARγ target genes is upregulated in 2a2iL‐hPSCs. Adjusted P < 0.05 (adjusted P‐value was obtained using the Benjamini and Hochberg correction to determine the false discovery rate with a log2 fold change > 1).