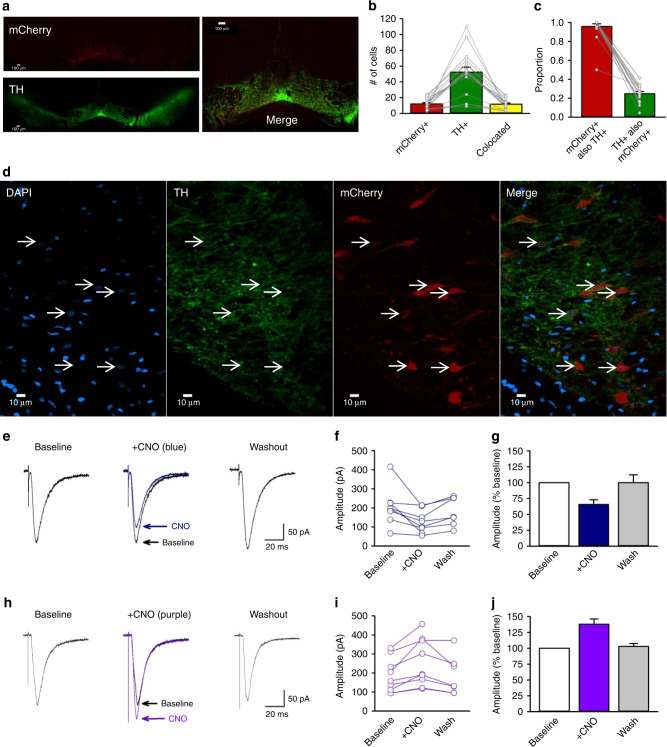
Fig. 5. Validation of circuit-specific chemogenetic approach.
a Representative coronal ×4 optical plane through the VTA showing fluorescence indicative of mCherry (red; top; hM4Di reporter) and TH (green; bottom; Alexa 488), and corresponding merged image (right). b The number of cells (n = 948 cells across four rats) counted in each 300 × 300 μm optical section. c Cell counts indicate the specificity of mCherry expression in TH+ neurons and the proportion of TH+ neurons that were transfected (n = 948 cells across four rats). d Representative area of a ×40 image used for the analyses in (b) and (c). Cells with colocalized TH and mCherry signals all had a nucleus indicated by DAPI (blue). e Example traces show averaged excitatory post synaptic currents (EPSCs) for an NAc core medium spiny neuron (MSN) before (baseline), during (+CNO), and after (washout) 5 min application of 1 μM CNO to striatal slices containing hm4Di-expressing terminals from VTA dopamine neurons. f Peak amplitudes of EPSCs recorded from individual MSNs innervated by hM4Di-expressing dopaminergic terminals (n = 8 cells across five rats). g Normalized mean EPSC amplitudes for the same group of cells. Clozapine-n-oxide reduced EPSC amplitude to 65.7 ± 7.3% of baseline [n = 8 cells across five rats; F(2,13) = 6.77, p = 0.01; Newman−Keuls p = 0.01]. Mean EPSC amplitude returned towards baseline values within 20 min of washout (93.9 ± 8.9% of baseline). h Example traces show averaged EPSCs for an MSN before (baseline), during (+CNO), and after (washout) 10 min application of CNO to striatal slices containing excitatory hM3Dq-expressing terminals from VTA dopamine neurons. i Peak amplitudes of EPSCs recorded from individual MSNs innervated by hm3Dq-expressing terminals (n = 9 cells across five rats). j Normalized mean EPSC amplitudes for the same group of cells. Clozapine-n-oxide significantly increased EPSCs to 137.9 ± 18.8% of baseline levels, [n = 9 cells across five rats, F(2,14) = 17.84, p < 0.001; Newman−Keuls p < 0.001]. Responses returned to baseline values within 20 min of washout (102.9 ± 4.7% of baseline). Averaged data are mean ± s.e.m. Data were analysed using RM ANOVA (g, j) and Newman−Keuls post hoc tests (g, j). All statistical tests were two-sided. Raw data are available as a supplementary source data file.

