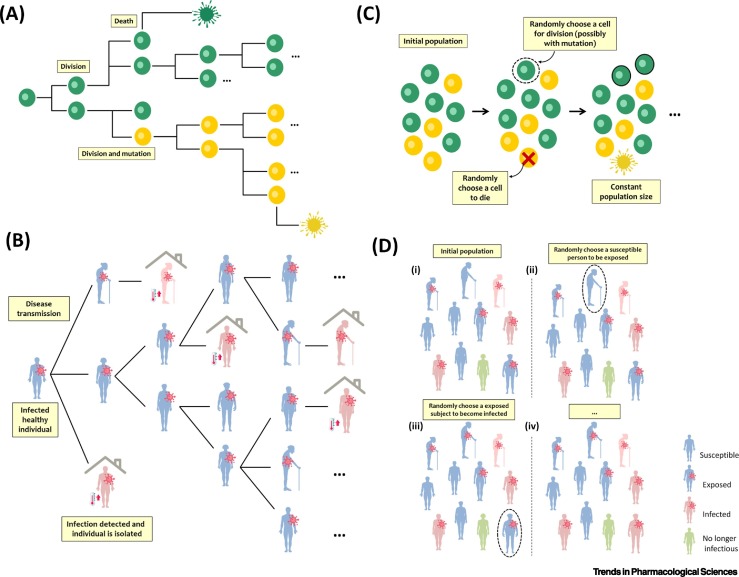
Figure I.
Schematic Representation of Branching and Moran Processes.
(A) Schematic representation of a two-type branching process for modeling clonal evolution of cancer cells where new (epi)genetic alterations emerge as random events during cell division and give rise to tumor subclones with fitness (birth and death rates) different from that of their ancestors. (B) Schematic representation of a two-type branching process to characterize infectious disease transmission. Here, contaminated but healthy individuals (blue color) infect a random number of individuals. Infected cases can be detected (red color) and isolated from the population to stop spreading the virus. (C) Schematic showing a Moran process to describe clonal evolution where total population size is fixed. At each time step, a randomly chosen cell divides and the daughter cell replaces another cell that dies. Hence, the total number of cells remains constant. (D) Schematic representation of a stochastic SEIR (susceptible, exposed, infected, and no longer infectious) model where population size is always constant, but the number of individuals in each group varies depending on the transmission and recovery rates defined. (A) and (C) are based on the figure from [74].

