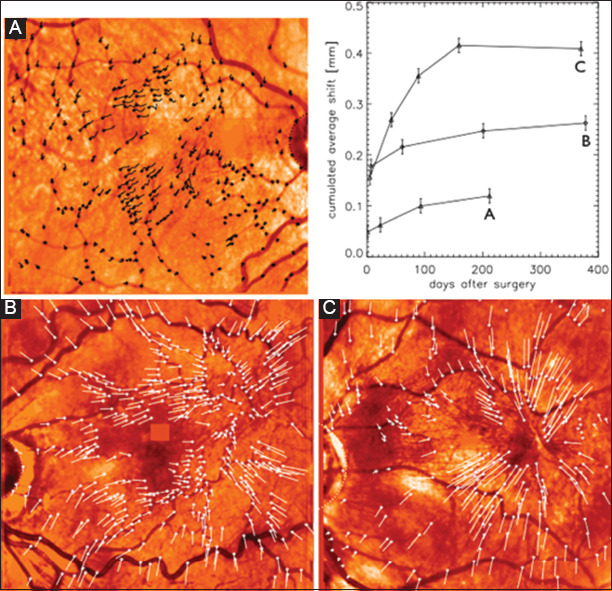
Figure 3.

Vector representation of surface vascular movement in selected patients and graphical representation of cumulated average shifts over the analyzed time period per patient. (For each patient, the final image post-operative image was compared to the pre-operative scanning laser ophthalmoscopy image to generate the vector representations. Each line represents the displacement and direction of representative points).
