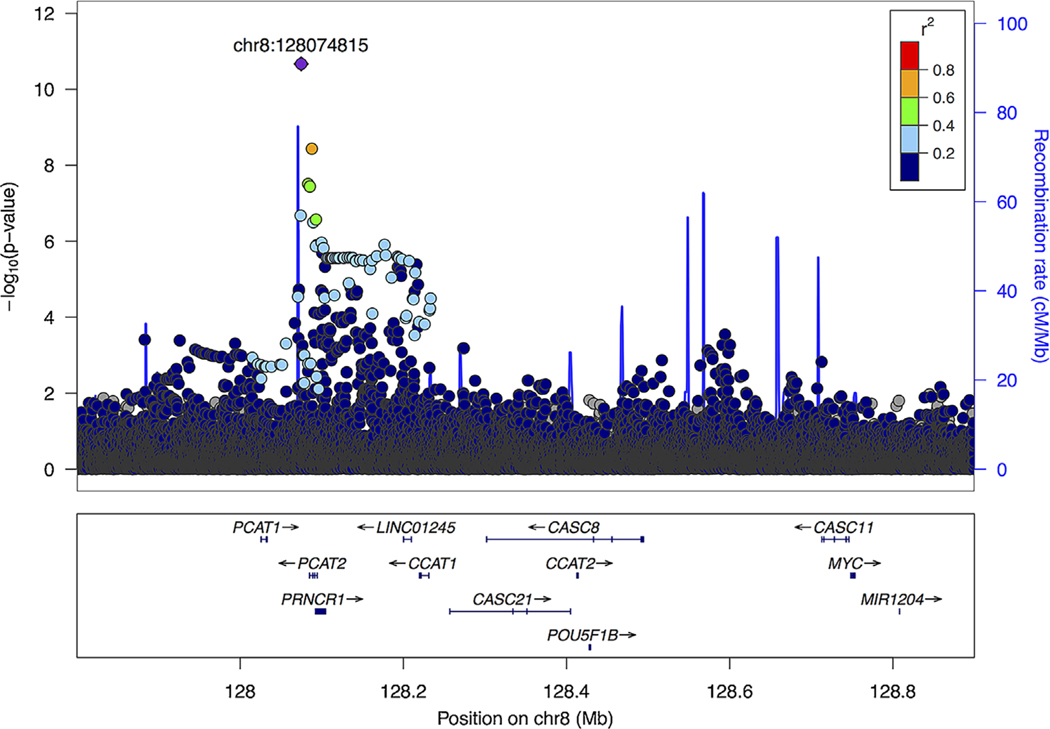
FIGURE 1.
Regional association plot of the 8q24 risk region (127.8–128.9 MB) in Ugandan men. Single-nucleotide polymorphisms (SNPs) are plotted by position (x-axis) and −log10 P-value (y-axis). LDs were estimated from AFR individuals in phase III 1000 Genomes Project (1KGP) data using r2 statistics. The most statistically significant associated SNP (purple diamond) is rs72725854, and the surrounding SNPs are colored to indicate pairwise correlation with the index SNP

