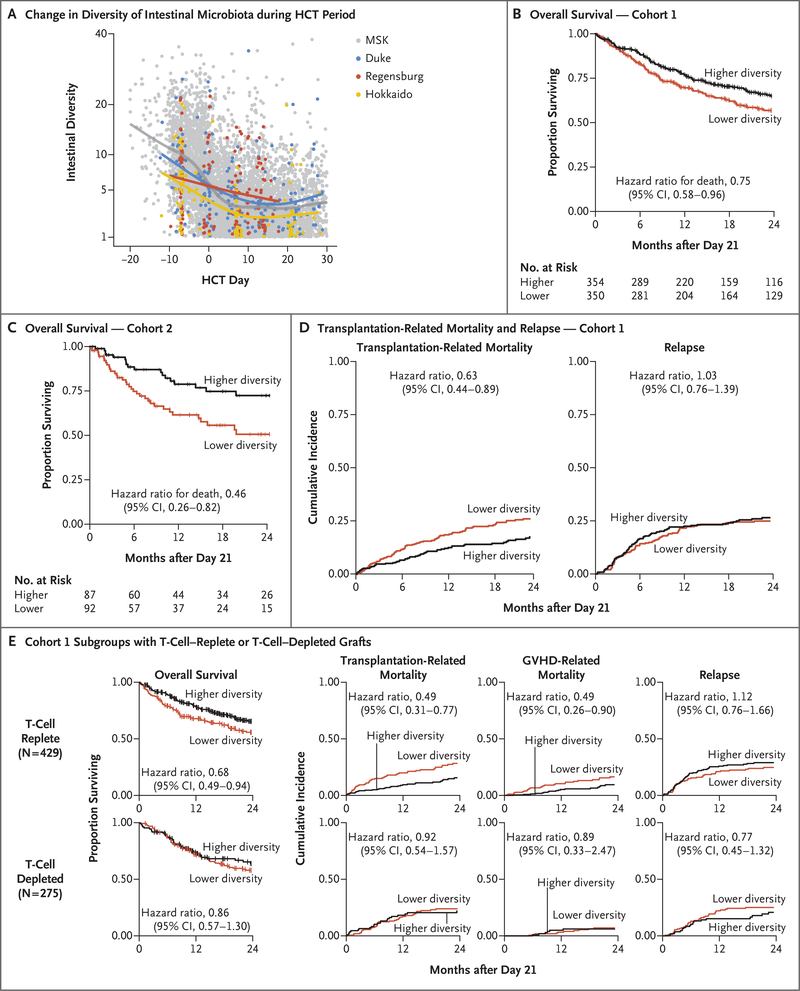
Figure 1 (facing page). Intestinal Diversity during Transplantation Period and Association with Overall Survival.
Intestinal microbiota diversity, as measured by 16S ribosomal RNA gene sequencing and the inverse Simpson index, declined similarly during the course of allogeneic hematopoietic-cell transplantation (HCT) at all four institutions (Panel A). Each point represents a stool sample, color coded according to institution. Curves are loess-smoothed averages. Between each patient’s baseline sample (earliest sample obtained on day −30 to −6) and the periengraftment period (median value of samples obtained from day 7 to 21), the median diversity decreased by a factor of 4.3 at Memorial Sloan Kettering Cancer Center (MSK); by a factor of 3.3 at Duke University Medical Center, Durham, North Carolina; by a factor of 1.7 at University Medical Center, University Hospital Regensburg, Regensburg, Germany; and by a factor of 2.5 at Hokkaido University Hospital, Sapporo, Japan (Fig. S2). Overall survival was longer among patients with higher intestinal diversity in periengraftment samples, both in cohort 1, which comprised patients from MSK (Panel B), and in cohort 2, which comprised patients from the other three sites (Panel C). Tick marks indicate censored data. The median diversity value in cohort 1 (2.64) was used as the stratification cutoff in these landmark analyses (day 21). In cohort 1, there were 104 deaths among 354 patients in the higher-diversity group and 136 deaths among 350 patients in the lower-diversity group; in cohort 2, there were 18 deaths among 87 patients in the higher-diversity group and 35 deaths among 92 patients in the lower-diversity group. CI denotes confidence interval. The cumulative incidences of transplantation-related death and of relapse or progression of disease are shown for cohort 1 (Panel D). There were 52 transplantation-related deaths in 354 patients in the higher-diversity group and 82 such deaths in 349 patients in the lower-diversity group. There were 84 relapse events in 354 patients in the higher-diversity group and 81 relapse events in 349 patients in the lower-diversity group. Panel E shows the subgroup analysis involving recipients of T-cell–replete (unmodified) grafts or T-cell–depleted grafts in cohort 1 (Fig. S4). The numbers of patients at risk in the analyses shown in Panels D and E are provided in Table S4. Subsets of the data plotted in Panels A and D have been reported previously.12,21

