
Figure 2: Dose Pre-Analysis and Uncertainty Flow Chart in Relation to “Best,” Low-end, and High-end Dose Sets.
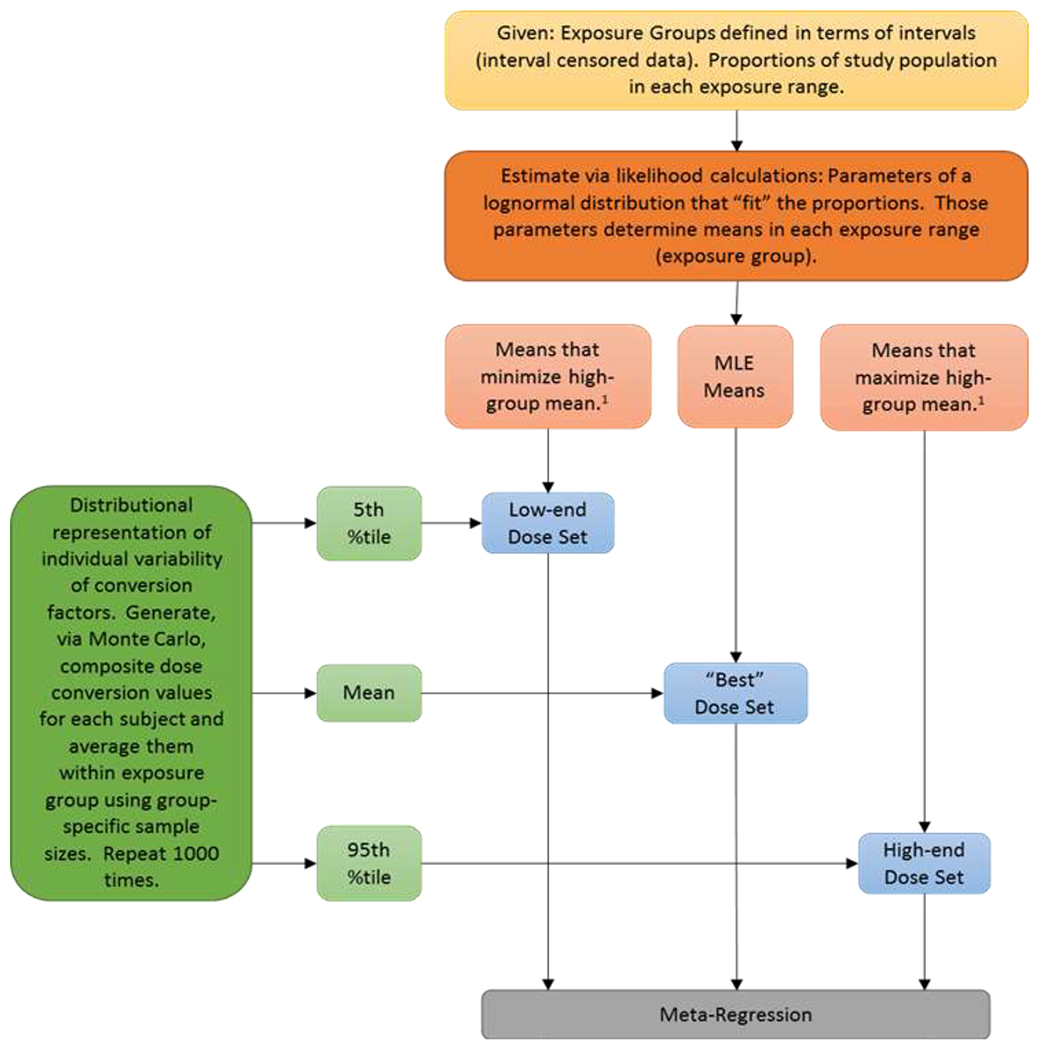
1 High group means minimized or maximized subject to constraint that −2 × (LL – MLL) ≤ 2.706 (a 95% bound on the high-group mean). LL is the log-likelihood for the lognormal distribution for the candidate parameter vector; MLL is the maximum log-likelihood. When a published study reports the mean or median values for each group, those values are used directly as the group-specific dose values, with no lognormal fitting. 2 The terminology “low-end,” “high-end,” and “best” estimates are used to avoid confusing the values with credible (or confidence) interval bounds having a specific numerical value (e.g., 95%). Combining the log-likelihood bounds for group-specific means, with percentiles from the Monte Carlo analysis does not allow determination that the bounding estimates have any identifiable associated “confidence level.” They do, however produce reasonable semi-quantitative limits on how uncertain the resulting estimates are.