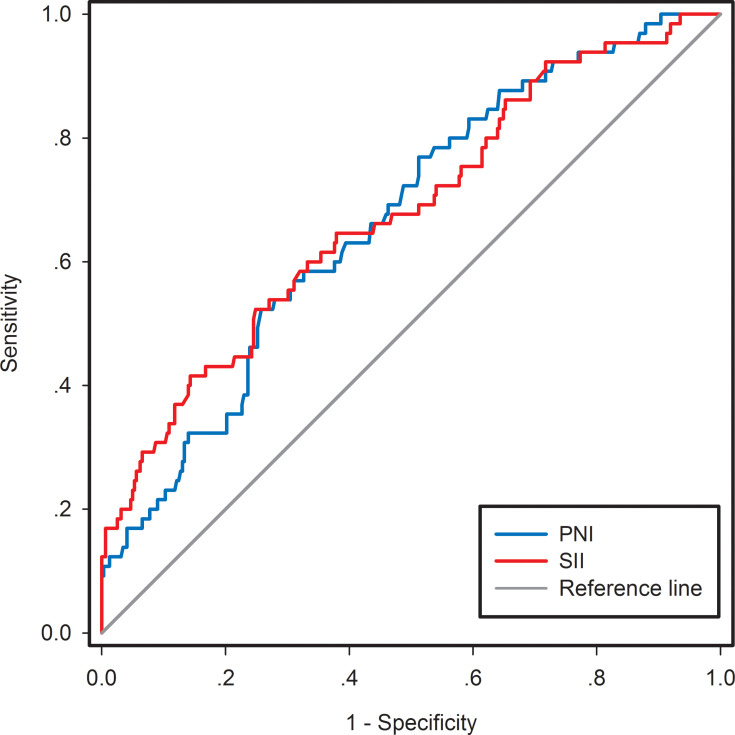
Figure 1.
ROC curve analyses for the optimal cut-off values of PNI and SII. Areas under the curve (AUCs) for 5-year OS were 0.668 (95% CI, 0.599-0.738, p<0.001) and 0.671 (95% CI, 0.604-0.753, p<0.001) for PNI and SII, respectively.
Abbreviations: ROC, receiver operating characteristic; PNI, prognostic nutritional index; SII, systemic immune-inflammation index; AUC, area under the curve; OS, overall survival.

