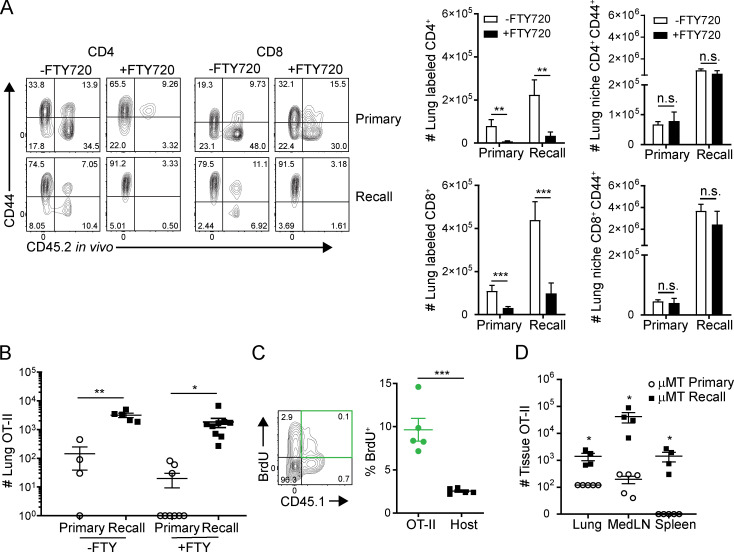
Figure S2.
Lung niche T cell migration during influenza infection and FTY720 treatment. (A) T cells were isolated from the lungs of memory and naive mice 5 d after PR8 challenge with or without daily FTY720 treatment. Left: Representative flow plot of lung CD4+ and CD8+ T cells showing CD44 expression versus in vivo administered CD45.2 antibody labeling. Right: Histograms depicting number of CD44+CD4+ or CD8+ T cells either labeled or protected by in vivo fluorescent antibody with or without FTY720 treatment. n = 4 or 5 mice per group. (B) CD44loCD45.1+ OT-II indicator population is transferred into both naive and memory mice and challenged with PR8-OVA (PR8-OTII). Lung cells were isolated 5 d after PR8-OVA challenge. Graph depicts number of lung CD4+CD45.1+ OT-II T cells during the primary and recall responses with or without FTY720 treatment. Data were compiled from two independent experiments; n = 4–9 mice/group. (C) BrdU incorporation by lung OT-II cells and CD45.1− host polyclonal cells 5 d after recall challenge with PR8-OVA. Data are representative of two independent experiments; n = 3–5 mice/group. (D) OT-II cells in the lung, medLN, and spleen of μMT hosts 4 d after primary or recall challenge shown in representative flow cytometry plots (left) and graphs depicting total numbers of OT-II cells in each tissue site in primary or recall responses. Data are representative of two independent experiments; n = 3–5 mice/group/experiment. Significance was determined by Student’s unpaired t test; ***, P ≤ 0.001; **, P ≤ 0.01; *, P ≤ 0.05. Error bars show mean ± SEM. n.s., not significant.

