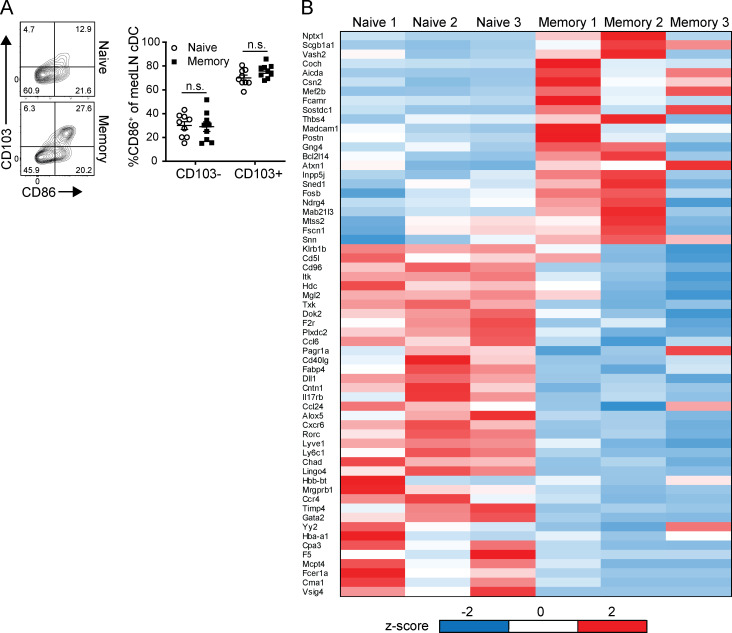
Figure S3.
Qualitative analysis of cDCs in the medLN of memory compared with naive mice. (A) CD103+ lung migratory cDCs exhibit elevated CD86 expression. Analysis of CD86 expression by CD103-expressing cDC subsets in naive and memory mice is shown in representative flow cytometry plots of medLN zbtb46+ cDCs (left) and graph depicting percentage CD86 expression by CD11b−CD103+ and CD11b+CD103− medLN cDCs (right). Data were compiled from three experiments; n = 9 mice/group. (B) Whole-transcriptome profiling of medLN cDCs from Fig. 6 D. Heat map of top differentially expressed genes between naive and memory cDCs based on transcripts per million (TPM) and determined by Padj ≤ 0.05 and mean fold difference ≥2. z-Score is based on SD from mean TPM value per gene. Error bars show mean ± SEM. n.s., not significant.

