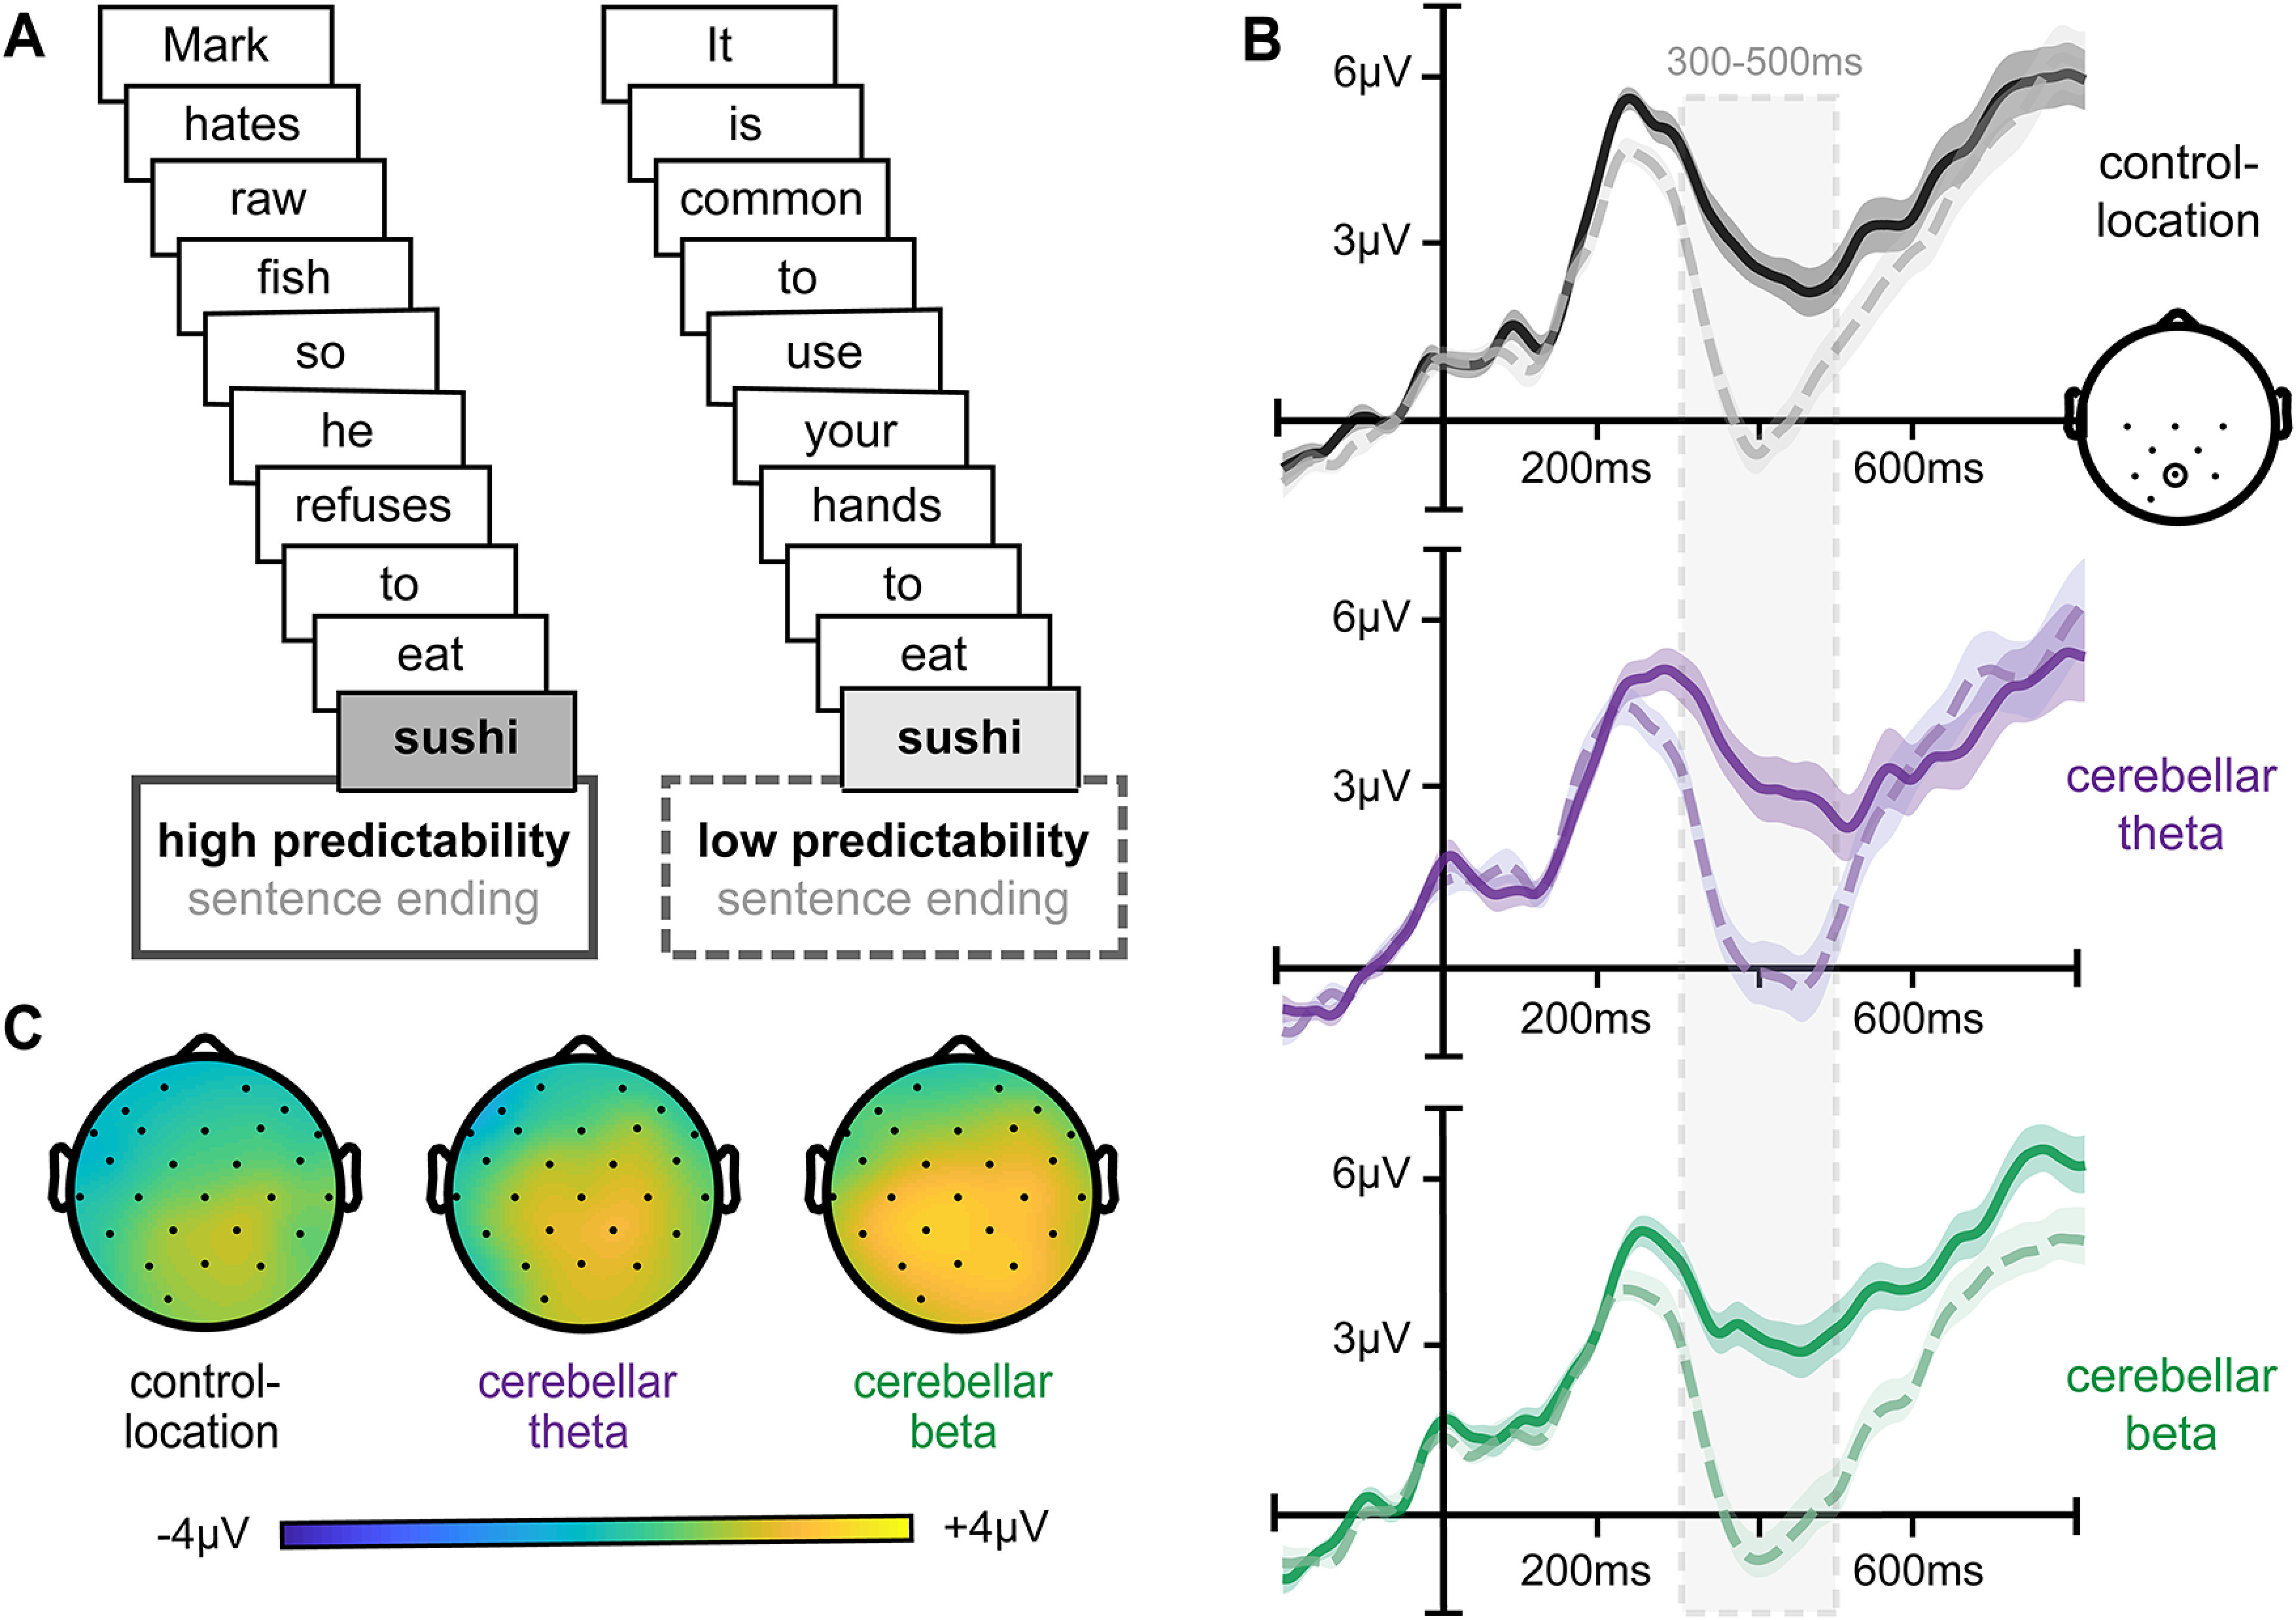
Figure 2.

Typical ERP signals of semantic prediction for each stimulation condition. A, Example sentences for high versus low predictability sentence-final words. B, Average ERPs to high-predictability (solid) and low-predictability (dashed) words, plotted for a representative centroposterior electrode (Pz) for all three stimulation conditions. C, Scalp topography of the N400 effect (i.e., difference between high-predictability and low-predictability words) for each stimulation condition shows a greater and more widespread N400 distribution following cerebellar beta stimulation relative to control-location stimulation. Shading on ERP waveforms indicates the SD of the group mean.
