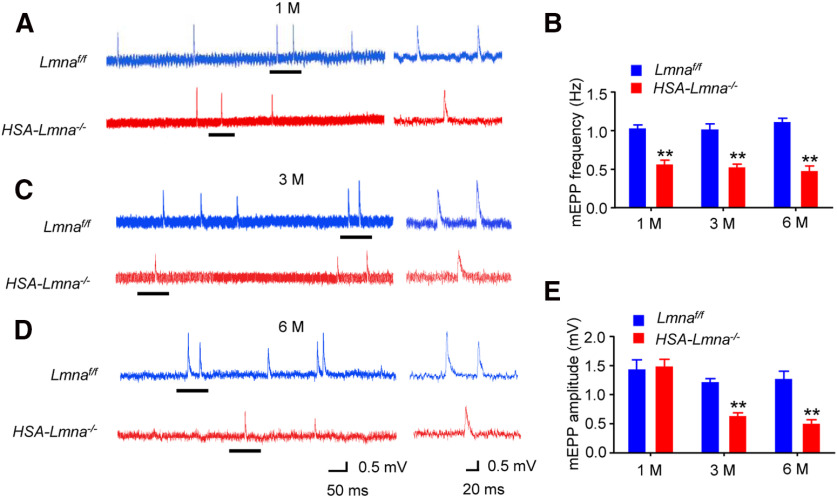
Figure 6.
Progressive NMJ transmission deficits in HSA-Lmna−/− mice. Progressive reduction in mEPP frequency and amplitude in mutant mice. A, C, D, Representative mEPP traces of 1 M (A), 3 M (C), and 6 M (D) control and mutant mice. Underlined regions on the left were enlarged and shown on the right. B, Reduced mEPP frequency in mutant mice at different ages; t(4) = 7.730, **p = 0.0015 for 1 M; t(4) = 6.361, **p = 0.0031 for 3 M; t(4) = 8.497, **p = 0.0011 for 6 M. E, Reduced mEPP amplitude in mutant mice at 3 and 6 but not 1 M; t(4) = 0.2594, p = 0.8081 for 1 M; t(4) = 8.151, **p = 0.0012 for 3 M; t(4) = 5.823, **p = 0.0043 for 6 M. Data were shown as mean ± SEM, unpaired t test, n = 3 mice per group.

