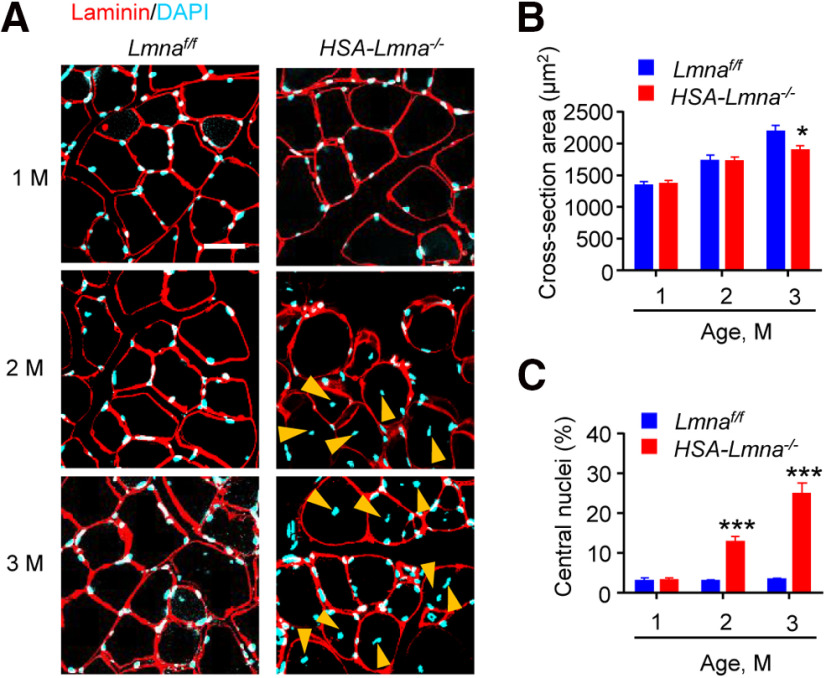
Figure 7.
Reduced muscle size and increased central nuclei in HSA-Lmna−/− mice. A, Cross-sections of TA muscles were stained with laminin antibody (visualized by Alexa Fluor 594, red) and DAPI (blue). Yellow arrowheads, central nuclei. Scale bar, 20 μm. B, Reduced cross-section area in 3 M mutant mice compared with control mice. Data were shown as mean ± SEM, t(8) = 0.2521, p = 0.8073 for 1 M; t(8) = 0.0353, p = 0.9729 for 2 M; t(8) = 2.391,*p = 0.0438 for 3 M; unpaired t test, n = 5 mice per group. C, Increased central nuclei in 2 and 3 M mutant mice compared with control mice. Data were shown as mean ± SEM, t(8) = 0.110, p = 0.9154 for 1 M; t(8) = 6.968, ***p = 0.0001 for 2 M; t(8) = 7.614, ***p < 0.0001 for 3 M; unpaired t test, n = 5 mice per group.

