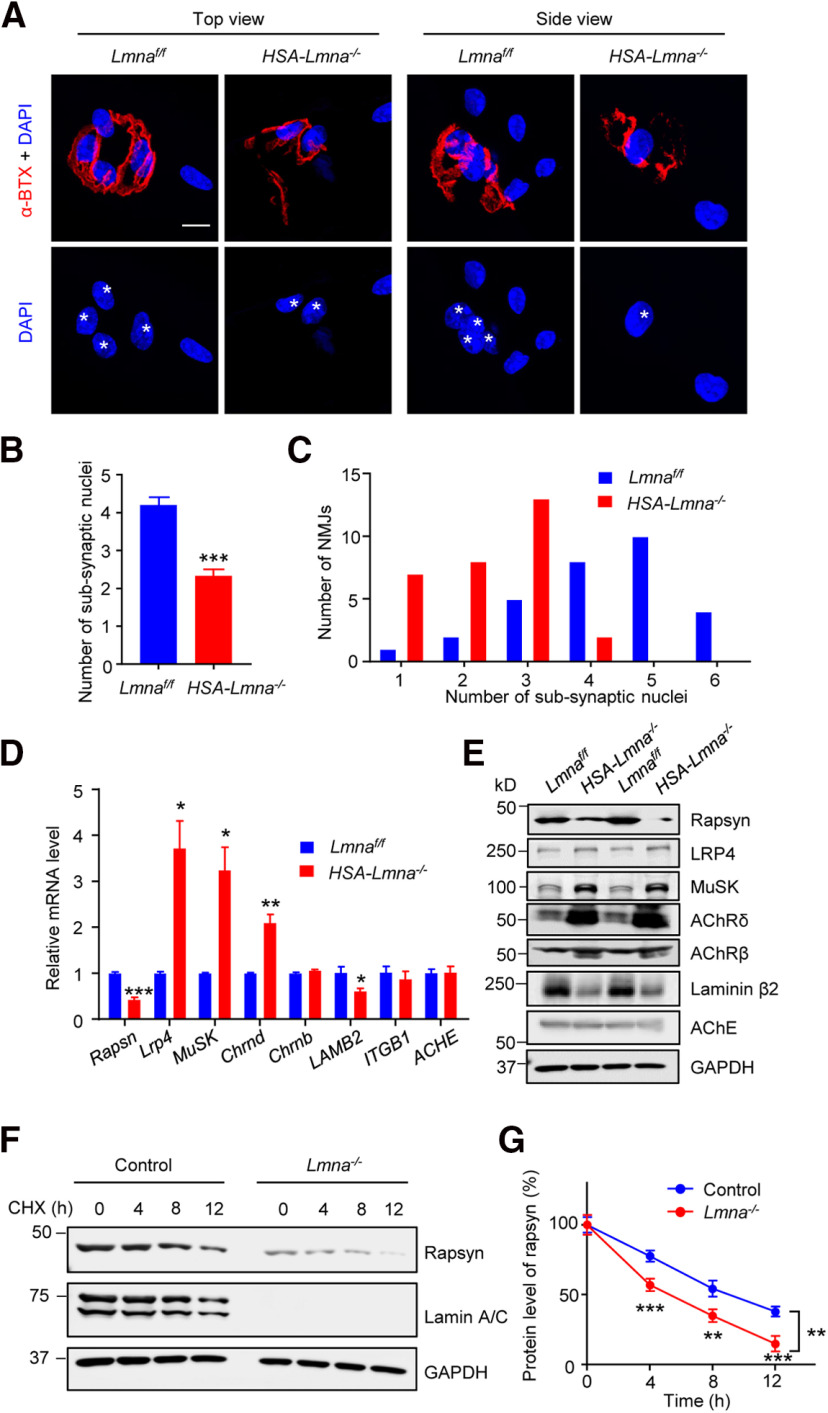
Figure 8.
Reduced rapsyn levels in HSA-Lmna−/− mice. A, Representative images of single muscle fiber in 3 M control and mutant mice. Muscle fibers were stained with CF568-conjugated α-BTX (red) and DAPI (blue). Scale bar, 10 µm. White asterisk, subsynaptic nucleus. B, Quantification of data in A showed decreased subsynaptic nuclei in mutant muscle. Data were shown as mean ± SEM, t(58) = 6.513, ***p < 0.0001; unpaired t test, n = 30 NMJs from 3 mice per group. C, Histograms showed the distribution of data in B. D, Reduced rapsyn mRNA levels in mutant mice. Data were shown as mean ± SEM, t(4) = 10.36, ***p = 0.0005 for Rapsyn; t(4) = 4.505, *p = 0.0108 for Lrp4; t(4) = 4.480, *p = 0.0110 for MuSK; t(4) = 5.919, **p = 0.0041 for Chrnd; t(4) = 1.960, p = 0.1216 for Chrnb; t(4) = 2.777, *p = 0.05 for LAMB2; t(4) = 0.6521, p = 0.5499 for ITGB1; t(4) = 0.099, p = 0.9255 for ACHE. Unpaired t test, n = 3 mice per group. E, Reduced rapsyn protein level from mutant muscles. F, Reduced rapsyn stability in Lmna mutant myotubes. C2C12 myotubes were treated with cycloheximide (CHX, 50 μg/ml) for indicated times and blotted for rapsyn. Protein level at 0 h in each individual group was normalized to 100%, respectively. G, Quantitative analysis for data in F. F(genotype)(1,4) = 23.35, **p =0.0084; ***p = 0.0007 for 4 h, **p = 0.0013 for 8 h, ***p = 0.0002 for 12 h. Data were shown as mean ± SEM; two-way ANOVA followed by Bonferroni's post hoc test, n = 3 independent experiments.

