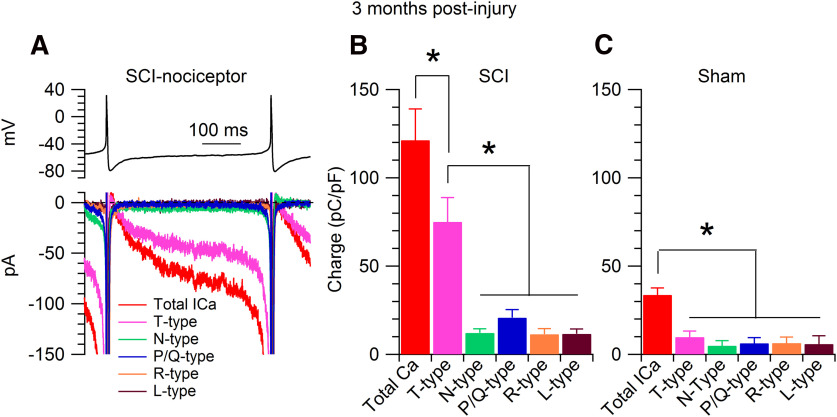
Figure 5.
Pharmacology of interspike calcium current. A, Recordings from a SCI-nociceptor isolated at three months postinjury. Top panel, Action potentials recorded in current clamp from a spontaneously active SCI-nociceptor were used as voltage command in voltage clamp. Bottom panel, Representative interspike currents isolated by subtracting traces (average of three consecutive traces) before and after application of a specific blocker. Total calcium current (red trace) isolated as the current sensitive to replacement of 2 mm Ca2+ with 2 mm Co2+ in the external solution; T-type calcium current (magenta trace) isolated as the current sensitive to 1 μm TTA-P2; N-type calcium current (green trace) isolated as the current sensitive to 2 μm ω-conotoxin GVIA; P/Q-type calcium current (blue trace) isolated as the current sensitive to 500 nm ω-agatoxin IVA; R-type calcium current (orange trace) isolated as the current sensitive to 200 nm SNX-482; L-type calcium current (brown trace) isolated as the current sensitive to 2 μm nimodipine applied on top of 2 μm ω-conotoxin MVIIC and 200 nm SNX-482. B, Interspike calcium charge in SCI-nociceptors. The charge was measured by integrating the interspike calcium currents from the afterhyperpolarization of the first action potential (−80 mV) to the time where the voltage reached −50 mV before the threshold for the second action potential. Total calcium charge (red bar, 121.3 ± 17.7 pC/pF, n = 72); T-type calcium charge (magenta bar, 75.1 ± 13.8 pC/pF, n = 72); N-type calcium charge (green bar, 12.1 ± 2.4 pC/pF, n = 13); P/Q-type calcium charge (blue bar, 20.8 ± 4.5 pC/pF, n = 11); R-type calcium charge (orange bar, 11.4 ± 3.2 pC/pF, n = 10); L-type calcium charge (brown bar, 11.6 ± 2.8 pC/pF, n = 9). One-way ANOVA followed by Tukey's post hoc comparison test, *p < 0.05. C, Interspike calcium charge in sham-nociceptors. Total calcium charge (red bar, 33.7 ± 3.9 pC/pF, n = 46); T-type calcium charge (magenta bar, 9.8 ± 3.4 pC/pF, n = 46); N-type calcium charge (green bar, 4.9 ± 2.8 pC/pF, n = 12); P/Q-type calcium charge (blue bar, 6.3 ± 3.2 pC/pF, n = 12); R-type calcium charge (orange bar, 6.4 ± 3.4 pC/pF, n = 9); L-type calcium charge (brown bar, 5.8 ± 4.7 pC/pF, n = 10). One-way ANOVA followed by Tukey's post hoc comparison test, *p < 0.05. Data are reported as mean ± SEM.

