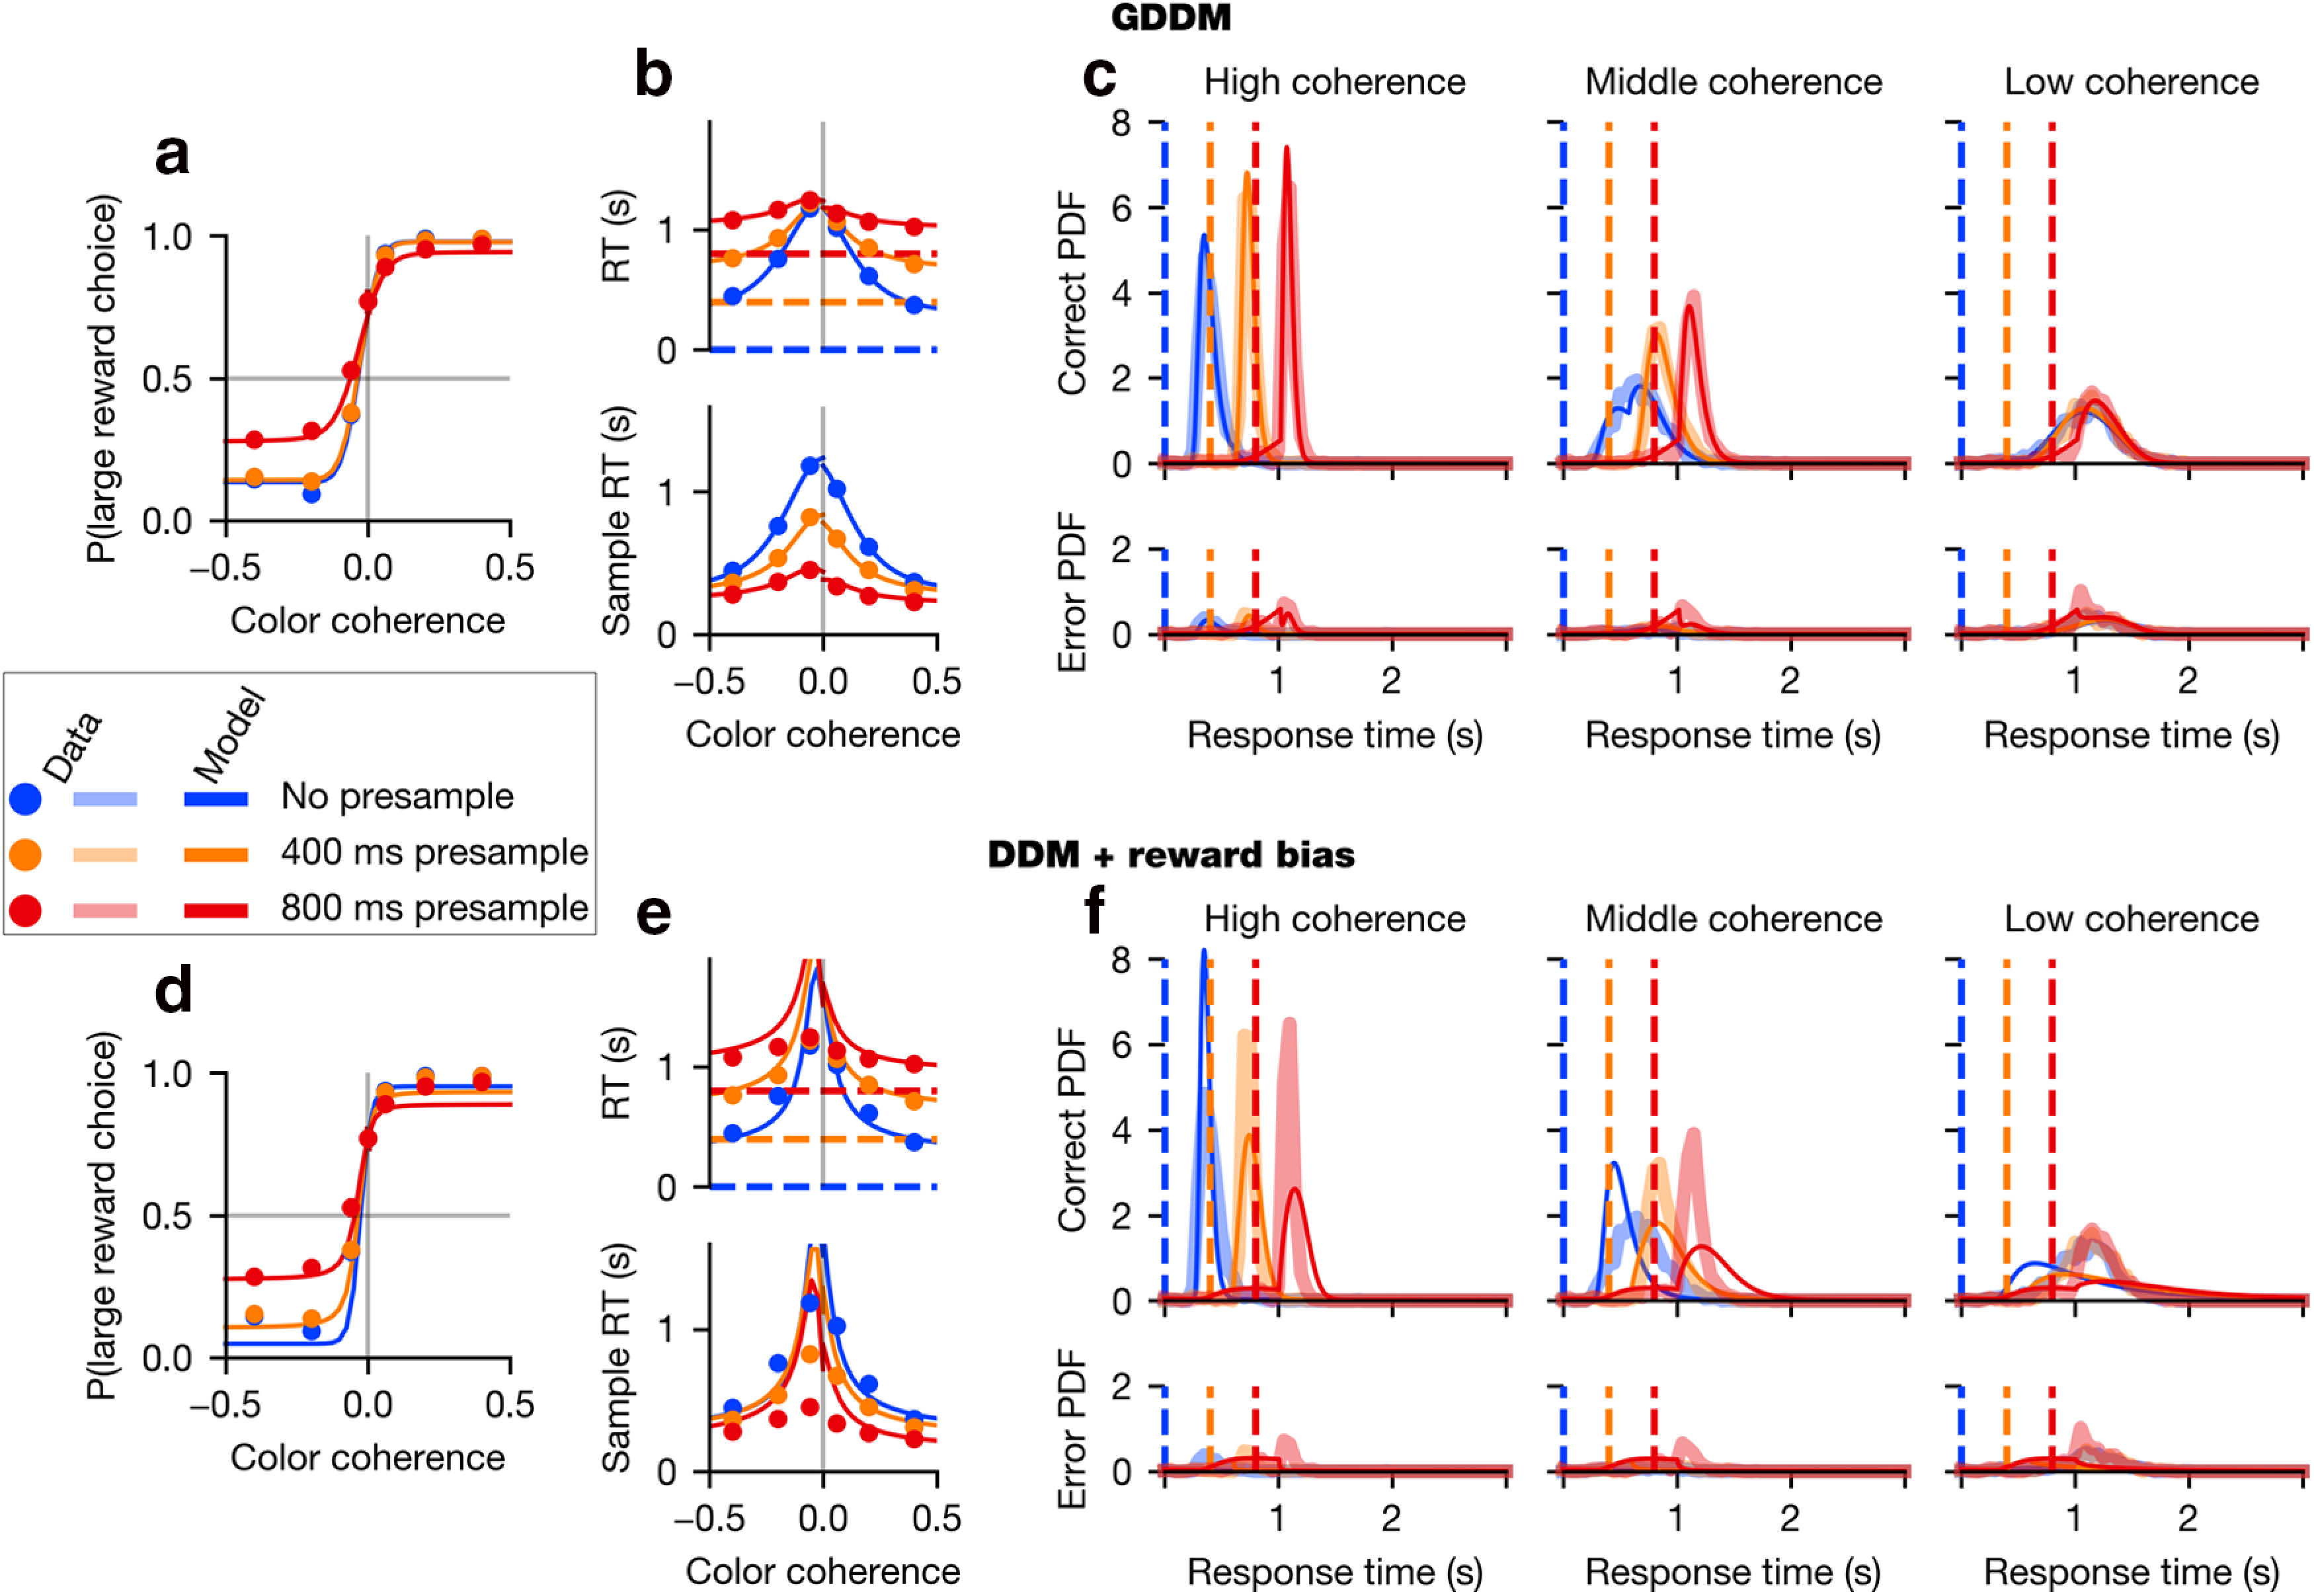
Figure 2.

Monkey 1 data and model performance. Psychometric (a, d) and chronometric (b, e) functions, as well as RT histograms (c, f), are plotted for the validation data of Monkey 1. Data are plotted for each coherence value as dots in the behavioral function (a, b, d, e) and as thick translucent lines in the probability distributions (c, f). “Sample RT” indicates the RT minus the presample duration. Overlaid in as a thin solid line is the model fit for the best-fit (a–c) GDDM with collapsing bounds described in “Modeling strategies during perceptual decision-making” or (d–f) DDM with reward mechanisms described in “Violation of time-invariant evidence accumulation”. Parameters were fit to the exploration data in each case. Error bars for 95% CI are hidden beneath the markers.
