Figure 1.
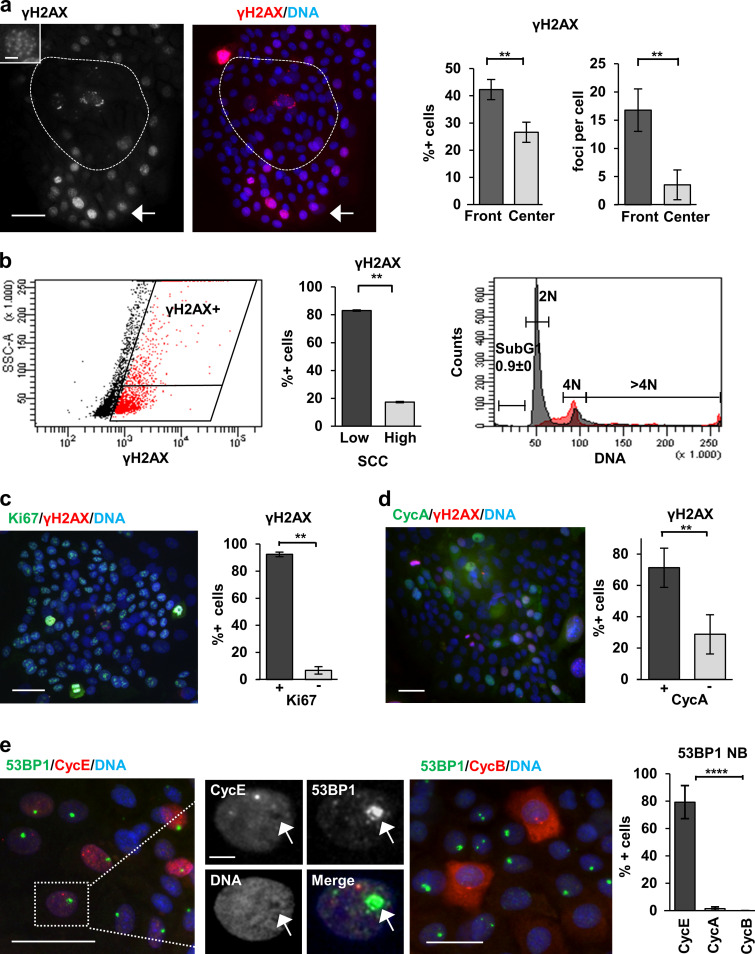
DNA damage signaling is active in proliferative human keratinocytes. (a) Detection of γH2AX (red). Note that γH2AX is mostly present in the proliferative fronts of the colonies (arrow). Broken line draws the center of the colony. Bar histograms: percentage of γH2AX-positive cells (left) or foci per cell (right) in the fronts or the center of the colonies. Amplified inset shows the numerous γH2AX foci of a peripheral nucleus. (b) FC analysis of DNA content (PI) and DNA damage (γH2AX) of primary keratinocytes. Dot plot: Side scatter (SCC) versus γH2AX expression. Note that most γH2AX-positive cells (red) display low SCC. Quantitation in bar histogram. Right plot: Cell cycle analysis of γH2AX-positive (red) or -negative (gray) cells. (c and d) Double IF for Ki67 (green, c) or cyclin A (CycA; green, d) and γH2AX (red). Bar histograms show percentage of γH2AX-positive cells that are positive or negative for Ki67 (a) or CycA (d). (e) Double IF for 53BP1 (green) and cyclin E (CycE; red, left panel), or cyclin B1 (CycB; red, right panel). Smaller panels: Separate colors as indicated of amplified region in white box (CycE). Note that 53BP1 NBs are mostly coexpressed with CycE, but they do not colocalize (arrow); they are excluded with mitotic CycB. Bar histogram: 53BP1 NBs positive for CycE, CycA, or CycB. Scale bar, 50 µm; inset scale bar, 10 µm. Blue in microscopy photographs is nuclear DNA by DAPI. Data in a, d, and e are mean ± SEM of at least n = 1,000 (a, d, and e) or n = 500 (c) cells of five or three fields, in b from sextuplicate samples, of representative experiments. Datasets were compared by an unpaired t test (two-sided). **, P < 0.01; ****, P < 10−5. See also Fig. S1, Fig. S2, and Fig. S3.

