Figure 4.
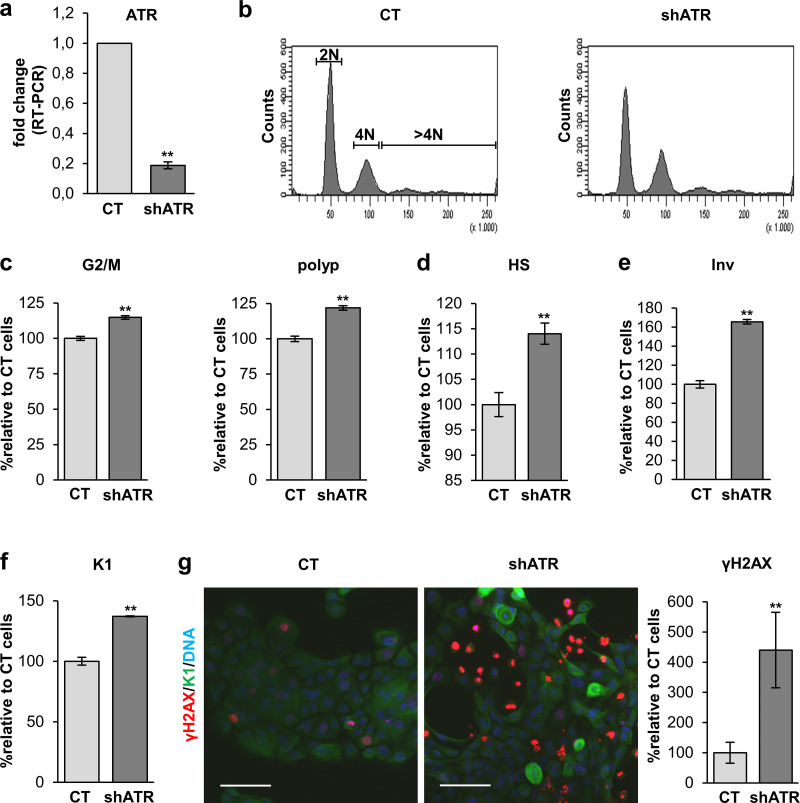
ATR silencing triggers squamous differentiation of human keratinocytes. (a) Detection of ATR expression in cells infected with shATR or the empty control vector pLKO1 (CT), by quantitative real-time (RT) PCR, relative to CT. (b) DNA content profile of cells 4 d after infection with the indicated vectors, as analyzed by FC. (c) Percentage of cells in G2/M (4N) or the polyploid (>4N) compartment of the cell cycle, relative to CT. (d) Percentage of cells with HS values relative to CT by FC. (e and f) Percentage of cells positive for Inv (e) or K1 (f) 5 or 4 d after infection with shATR or CT, respectively, as analyzed by FC and relative to CT. (g) Double IF for K1 (green) and γH2AX (red), 4 d after infection with shATR or CT as indicated. Bar histogram displays the percentage of keratinocytes positive for γH2AX as quantitated by IF, relative to CT. Nuclear DNA by DAPI. Scale bar, 50 µm. Data are mean ± SEM of duplicate (e–g) or triplicate (a, c, and d) samples. Datasets were compared by an unpaired t test (two-sided). **, P < 0.01. See also Fig. S4.

