Figure 6.
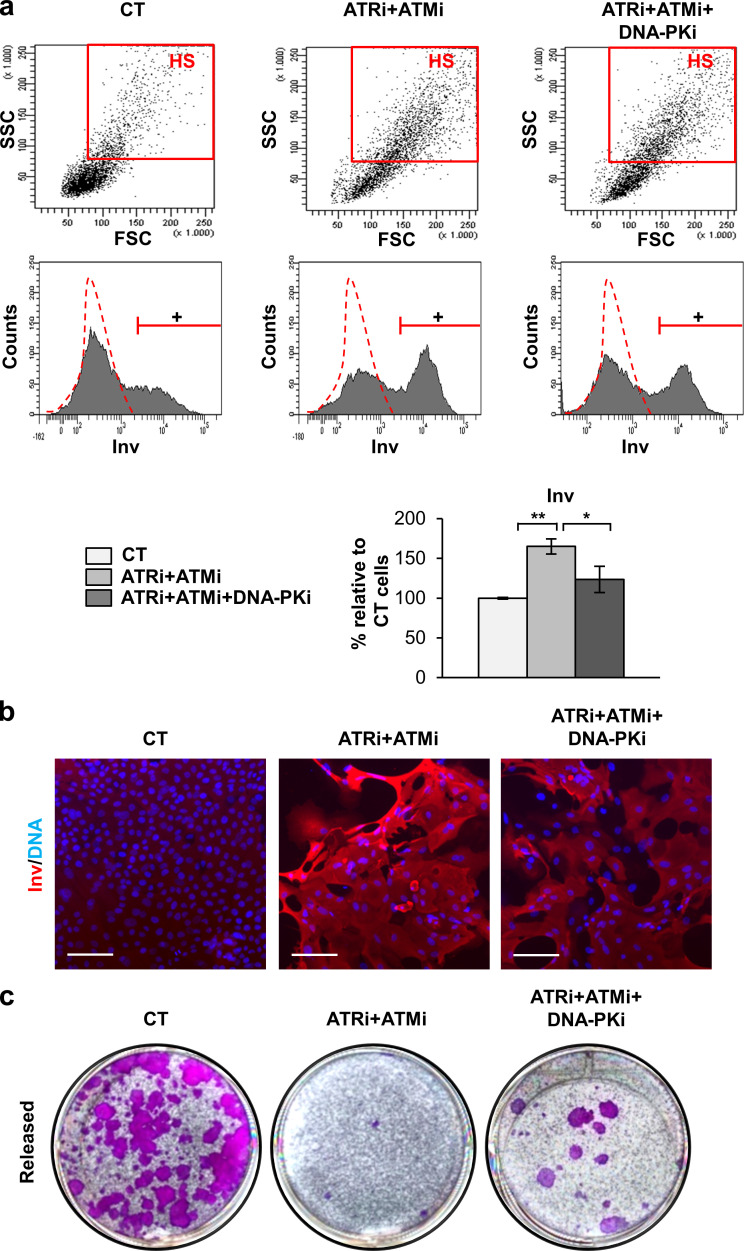
Inhibition of the three DDR kinases attenuates the squamous differentiation response. (a) Dot plots show light scatter parameters of cells 5 d after treatment with DMSO as control (CT), ATRi + ATMi, or ATRi + ATMi + DNA-PKi, as indicated, analyzed by FC. Red box: Cells displaying HS. Cell count histograms (middle lane) show the expression of Inv of cells treated for 5 d as indicated, by FC (+, positive keratinocytes according to negative isotype antibody control: red broken line). Bar histograms represent the percentage of keratinocytes expressing Inv relative to CT. Data are mean ± SEM of triplicate samples. Datasets were compared by an unpaired t test (two-sided). *, P < 0.05; **, P < 0.01. (b) Detection of Inv (red) in keratinocytes treated for 5 d as indicated, by IF. Nuclear DNA by DAPI. Scale bar, 50 µm. (c) Clonogenicity assays of keratinocytes released after 5 d of treatments as indicated. Figure shows representative images of duplicate samples. See also Fig. S5. FSC, forward scatter; SSC, side scatter.

