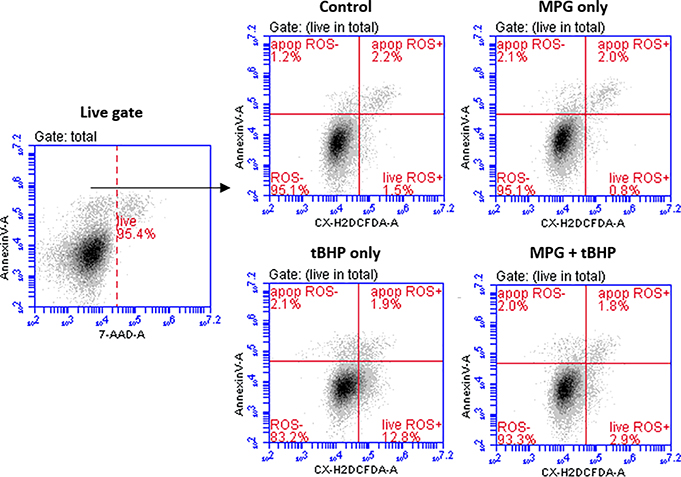
Figure 5.
Representative dot-plots from flow cytometry analysis of ROS in apoptotic and live subpopulations. The cells were gated to exclude debris. Viable cells were gated by exclusion of 7-AAD+ cells (FL-3) on 2D plots (live gate). The quantification of ROS was done using 2D plots of Annexin V Alexa 647 (FL-4) vs. Carboxy-H2DCFDA (FL-1).

