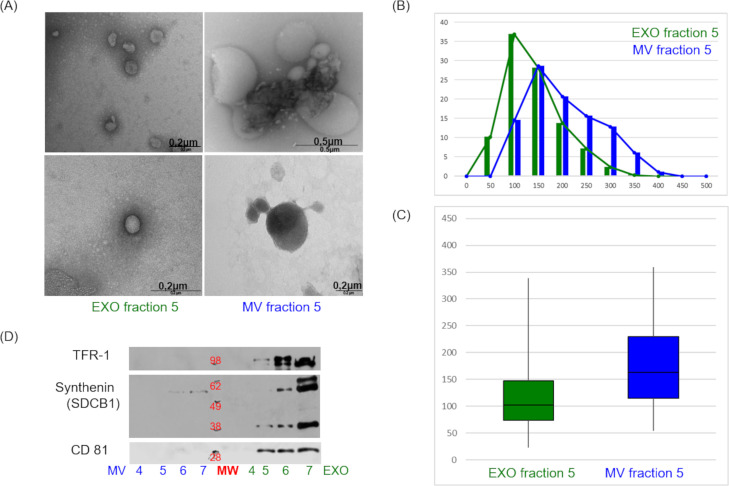
Fig 2. Exosome quality control.
Biochemical characterization of EVs isolated from plasma pools from healthy subjects. (A) About 20% of sample volume from gradient fractions EXO/MV 5 was fixed for TEM analyses. (B) The diameter size distribution of particles is shown in percentage of total particles number and (C) in box-plot diagram. The median value of exosome diameter was 102 nm, while that of microvesicles was 158nm. (D) WB analysis of exosome markers CD81 (1:400), Synthenin (1:400), TFR 1 (1:1000), exposition time 1 min.

