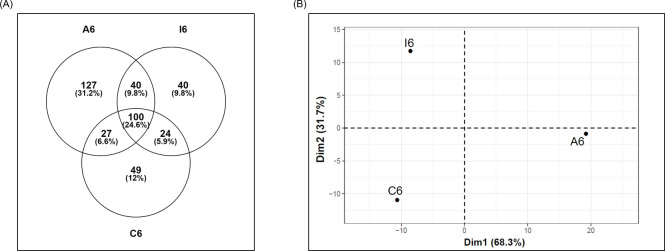
Fig 5. Comparative analysis of proteins detected in fraction 6 of Active, Inactive, and Control samples.
(A) Venn diagram showing the distribution of the proteins detected in fractions 6 datasets. (B) Principal component analysis (PCA) plot of samples based on fraction 6 datasets, i.e. the median intensity values of the proteins identified in fractions 6 of the replicas of each sample. The position of conditions in the two generated main components is plotted. Variability explained by the first and second components of the PCA is indicated between brackets.

