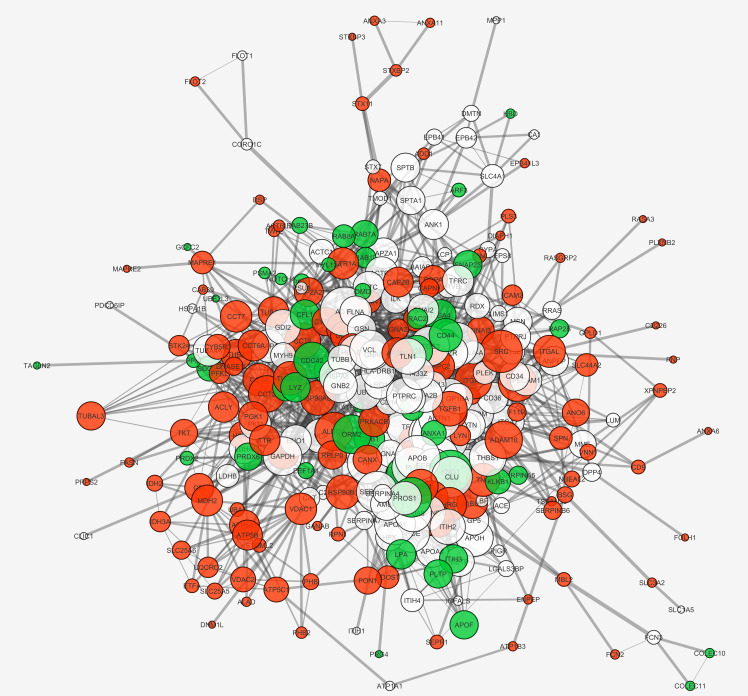
Fig 7. Dynet network.
The APhs and IPhs networks were superimposed in one graph by the use of the Dynet application, to highlight patient group-specific and shared central proteins. Proteins identified only in samples from individuals with active CE are coloured in red, proteins identified only in inactive CE samples in green, and proteins identified in both samples in white. The node degree (number of interactions) is visualized by node size and the edge score (confidence of node interaction) is directly proportional to the edge size. On the right side are clearly visible the central hubs of APhs network, i.e. the proteins Src, TGF-β and the integrins αM, αV, αL (ITGAM, ITAV, ITAL).

