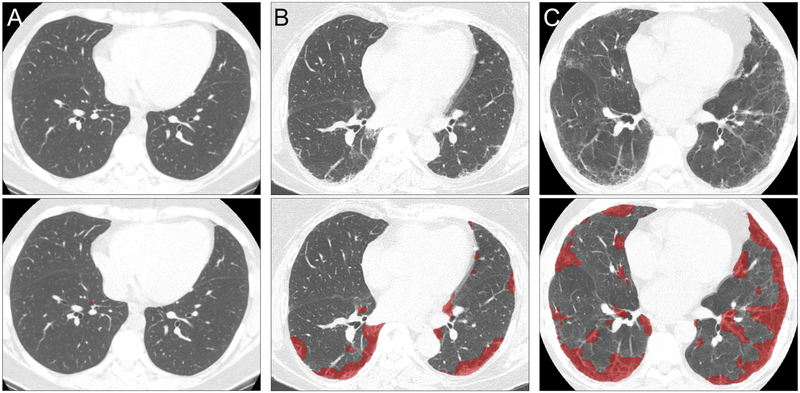
Figure 3. Categorization of Regions of HRCT Images using Quantitative Methodology.
Representative axial HRCT images visually assessed as “No Fibrosis” (A), “Probable Fibrotic ILD” (B) and “Definite Fibrotic ILD” (C). Below each is the corresponding quantitative HRCT results for the above scan; regions classified as fibrotic are shown in red. (A) “No Fibrosis” fibrosis extent 0.10% (log(fibrosis score) = −2.30); (B) “Probable Fibrotic ILD” fibrosis extent 12.46% (log(fibrosis score) = 2.52); (C) “Definite Fibrotic ILD” fibrosis extent 24.05% (log(fibrosis score) 3.18).

