Figure.

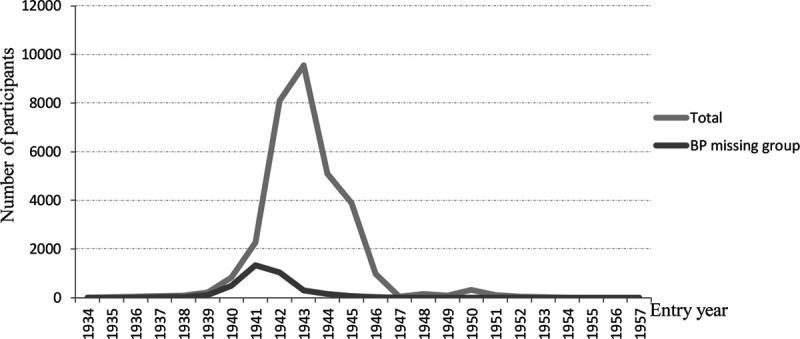
Distribution of the number of participants by entry year of the total cohort and the subgroup with missing blood pressure (BP) data.

Distribution of the number of participants by entry year of the total cohort and the subgroup with missing blood pressure (BP) data.