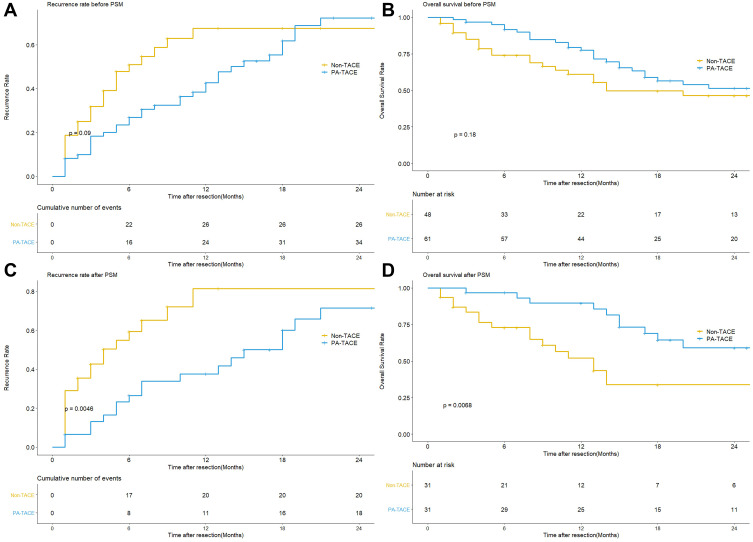
Figure 1.
(A) Comparison of recurrence rate between the PA-TACE and non-TACE groups before PSM. (B) Comparison of overall survival rate between the PA-TACE and non-TACE groups before PSM. (C) Comparison of recurrence rate between the PA-TACE and non-TACE groups after PSM. (D) Comparison of overall survival rate between the PA-TACE and non-TACE groups after PSM.

