Figure 3.
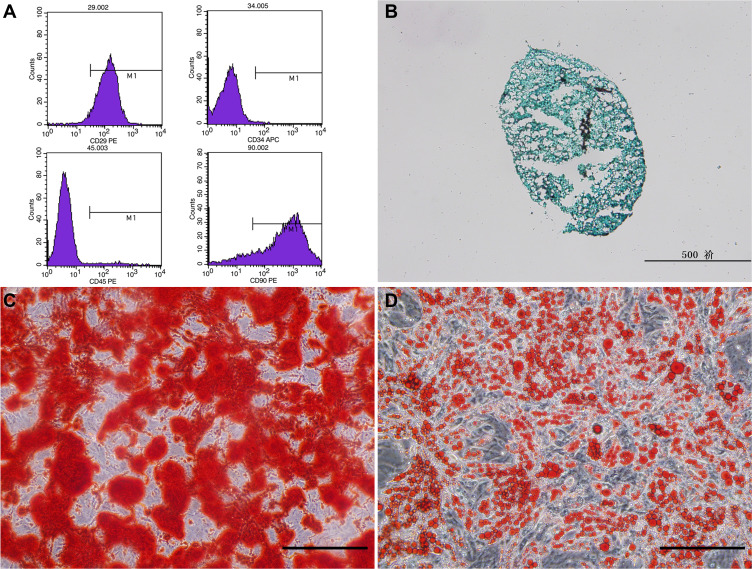
Expression of ASC surface marks detected by flow cytometry (A). Three lineages differentiation and corresponding identification of ADSCs (B–D). (B) alcian blue staining for chondrogenic induction. (C) alizarin red staining for osteogenic induction; (D) Oil red O staining for adipogenic induction; Scale bars: 200 µm in C and D, 500 µm in (B).

