Figure 4.
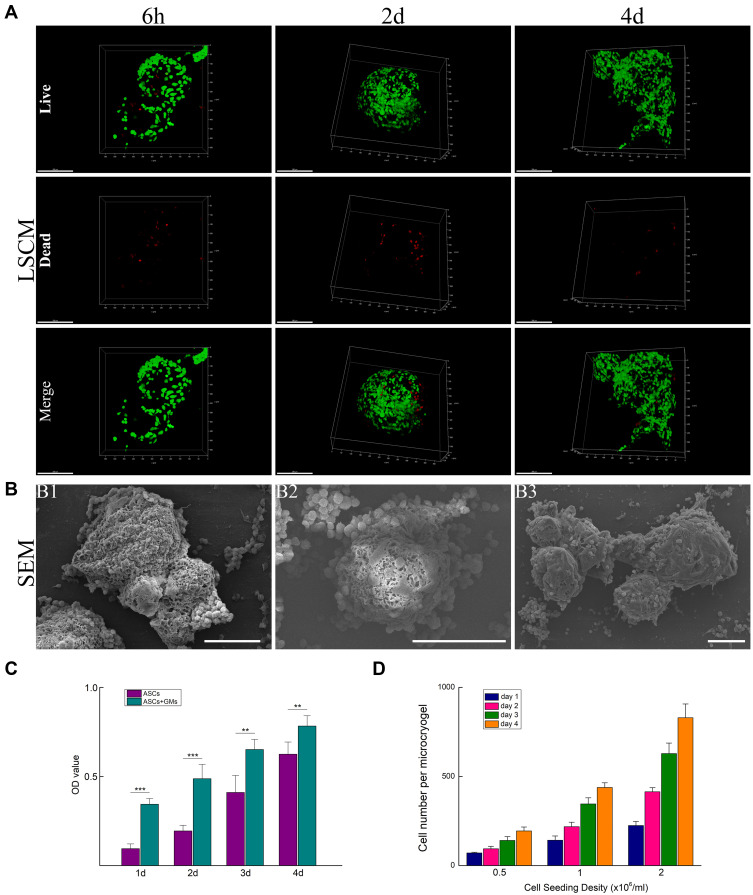
Laser scanning confocal microscope (LSCM) images of ASCs seeded in GMs showed attachment at 6 h postseeding, proliferation at 2 days and microunits aggregated after 4 days of culture (A). Green fluorescence represents viable cells. Red fluorescence represents dead cells. Scanning electron microscopy (SEM) of GMs laden with ASCs at 6 h and 2 days (B1, B2) postseeding and microunits aggregated and packaged with a large amount of secreted ECM after 4 days of culture (B3). Comparison of single ASC cultures with ASC-laden GM cocultures (C). Quantification of ASC loading and proliferation in GMs with different initial loading densities (D). Scale bars: 200 µm in A and 100 µm in B. Data are presented as the mean ± SD; statistical analyses were performed with the unpaired Student’s t-test; **P<0.01; ***P<0.001.

